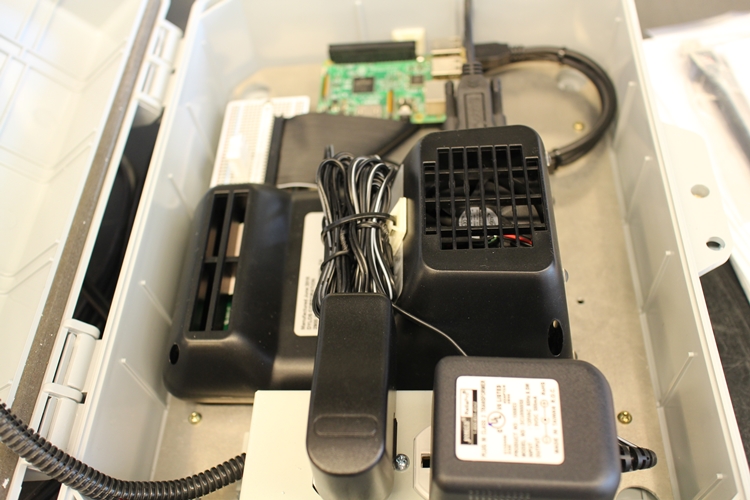
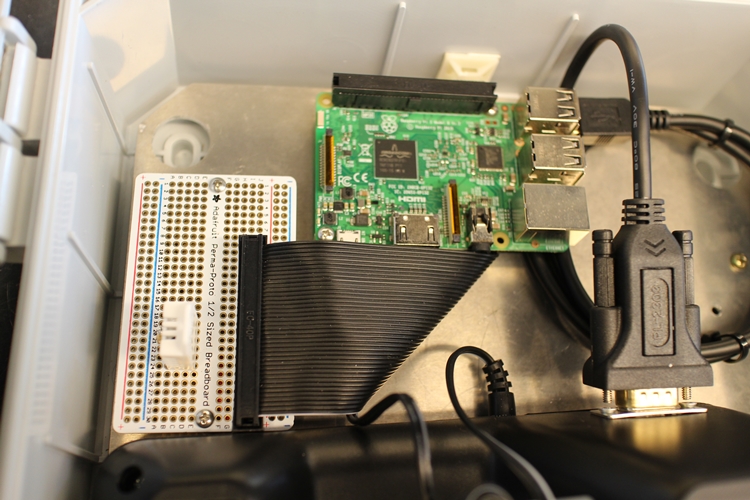
Sensors
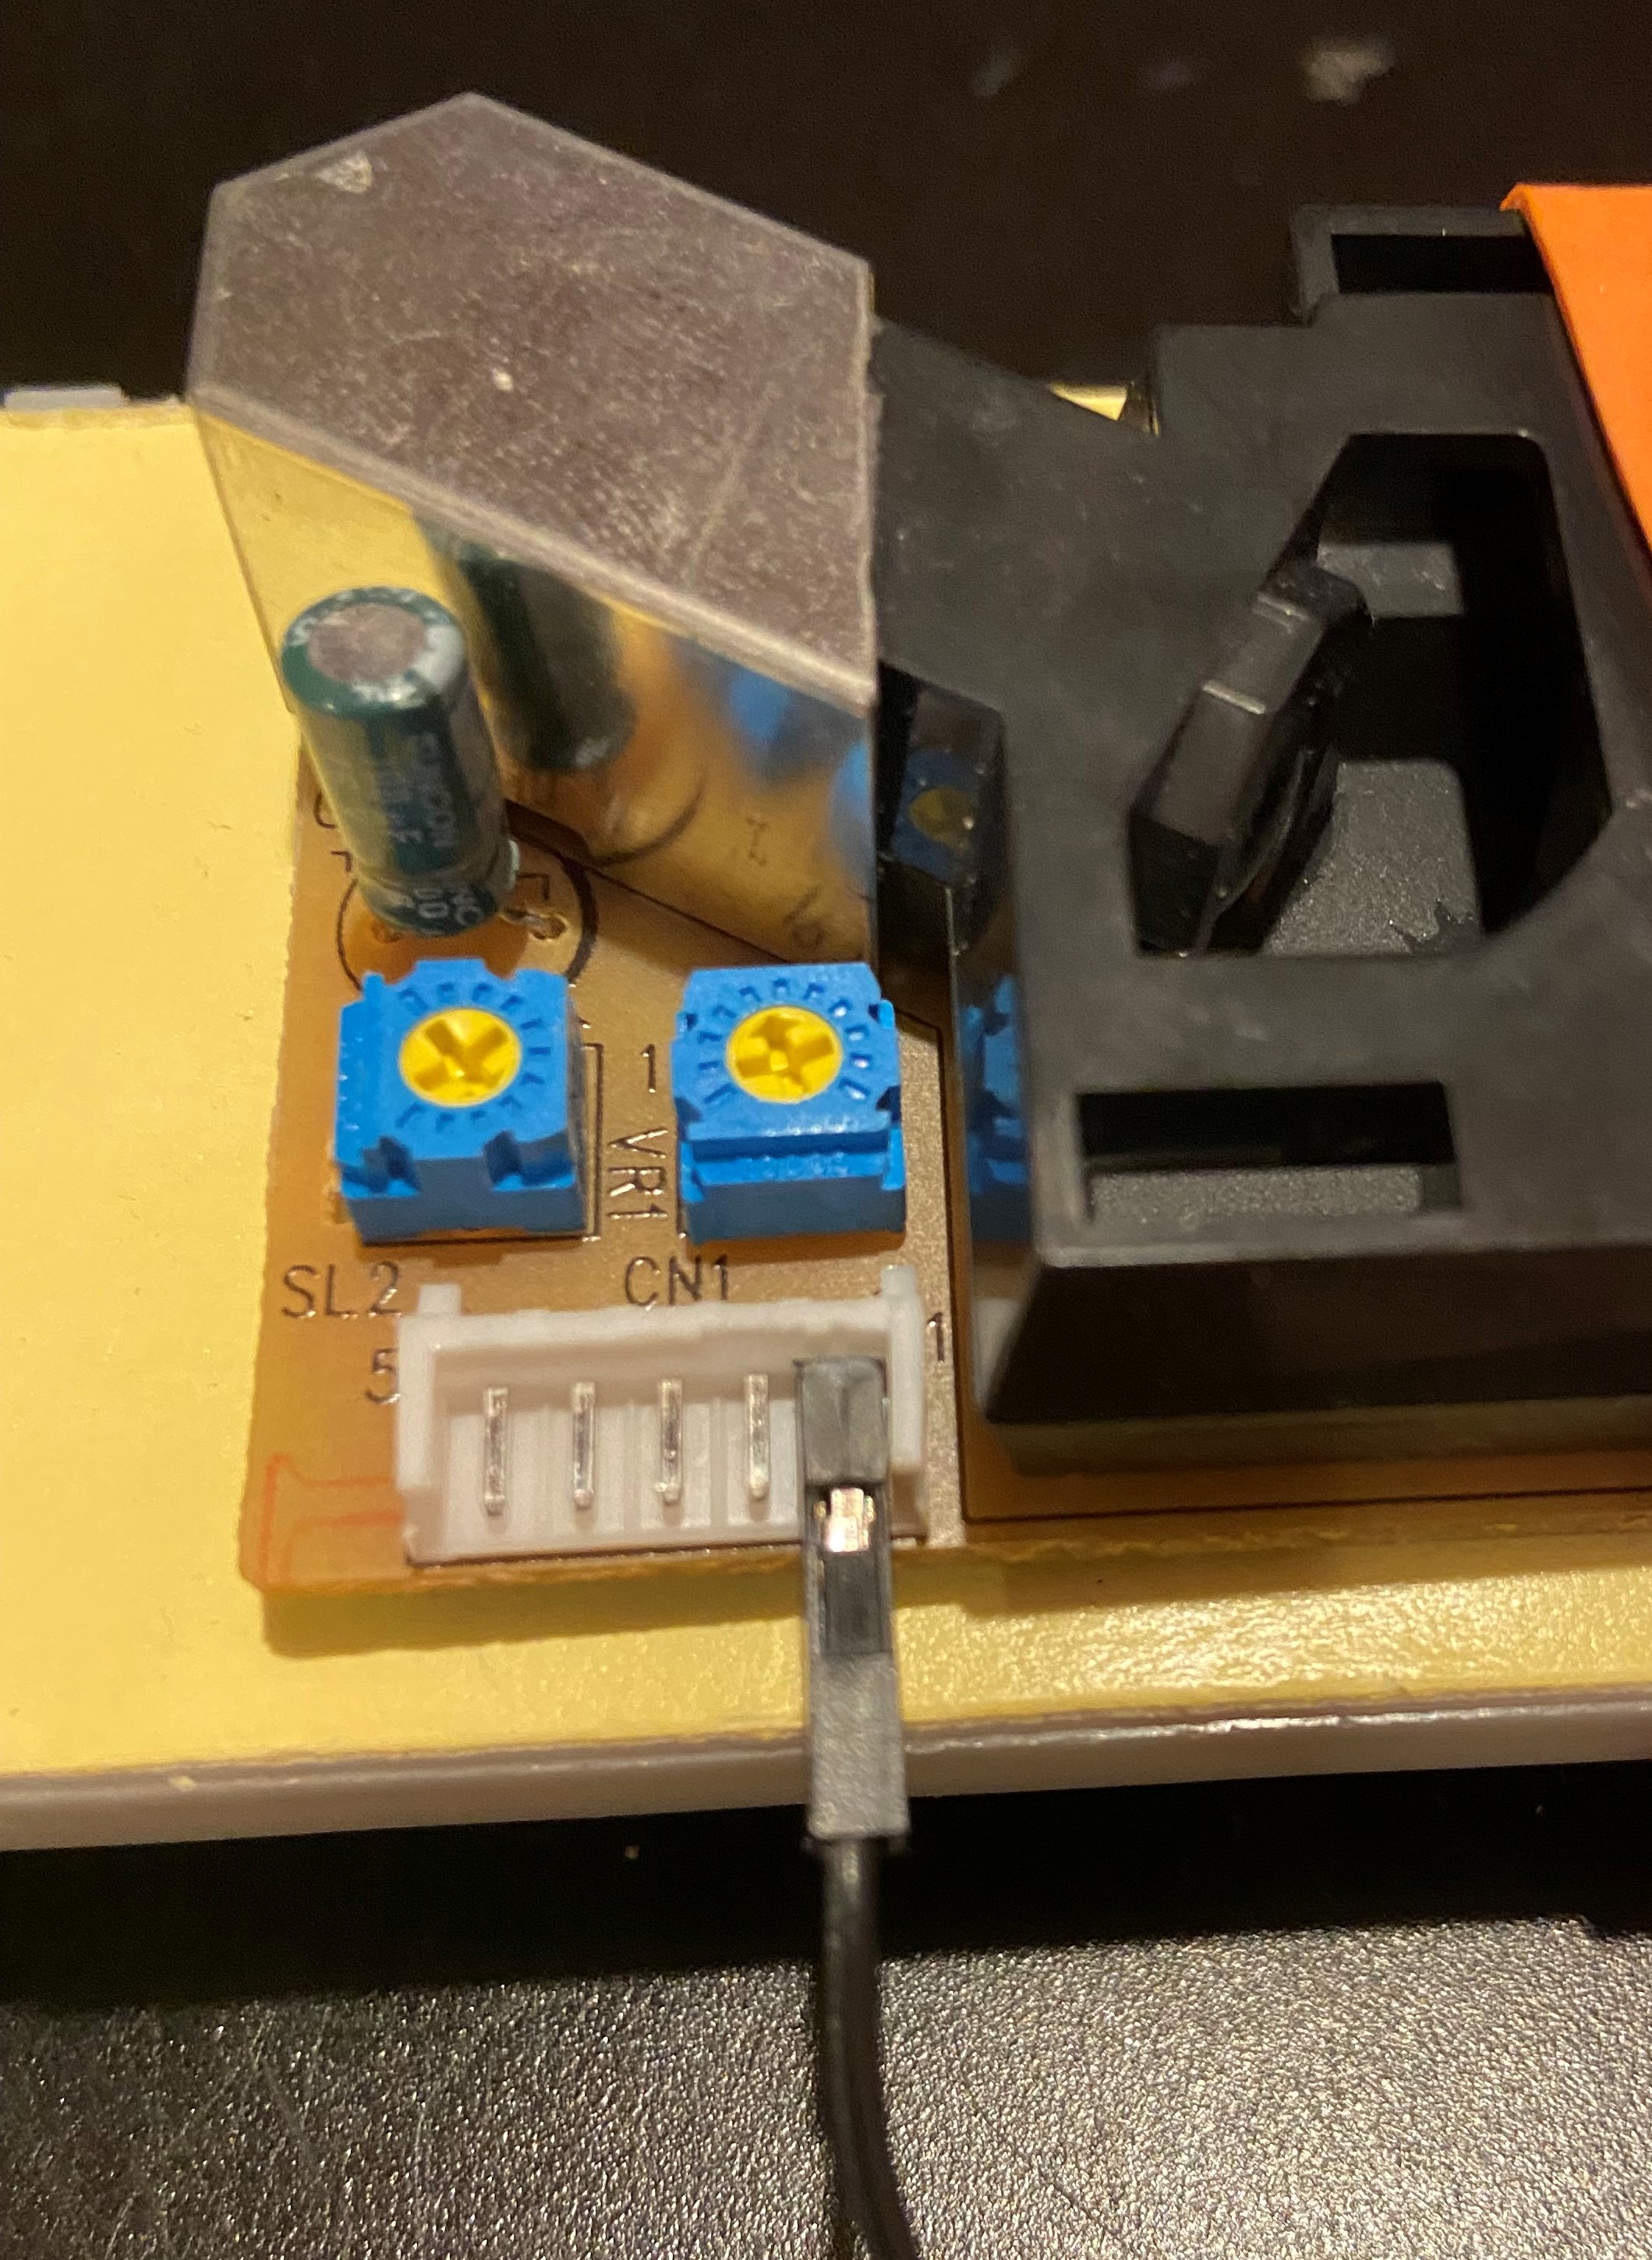
What's In Our Sensor?
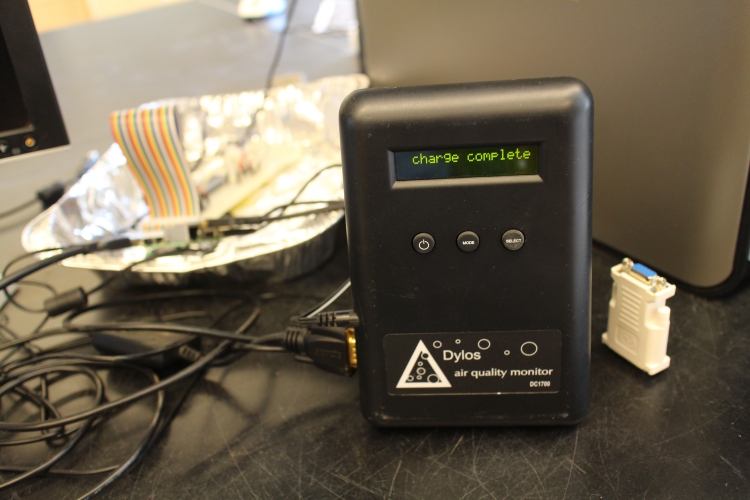
- Dylos DC1100: Laser particle counter that provides large and small particle counts.
- DHT22: Digital temperature and humidity sensor
- Raspberry Pi: Runs Python script and receives digital data from Dylos and DHT22 sensor. This data is stored internally in a CSV file and is transmitted to a google sheets.
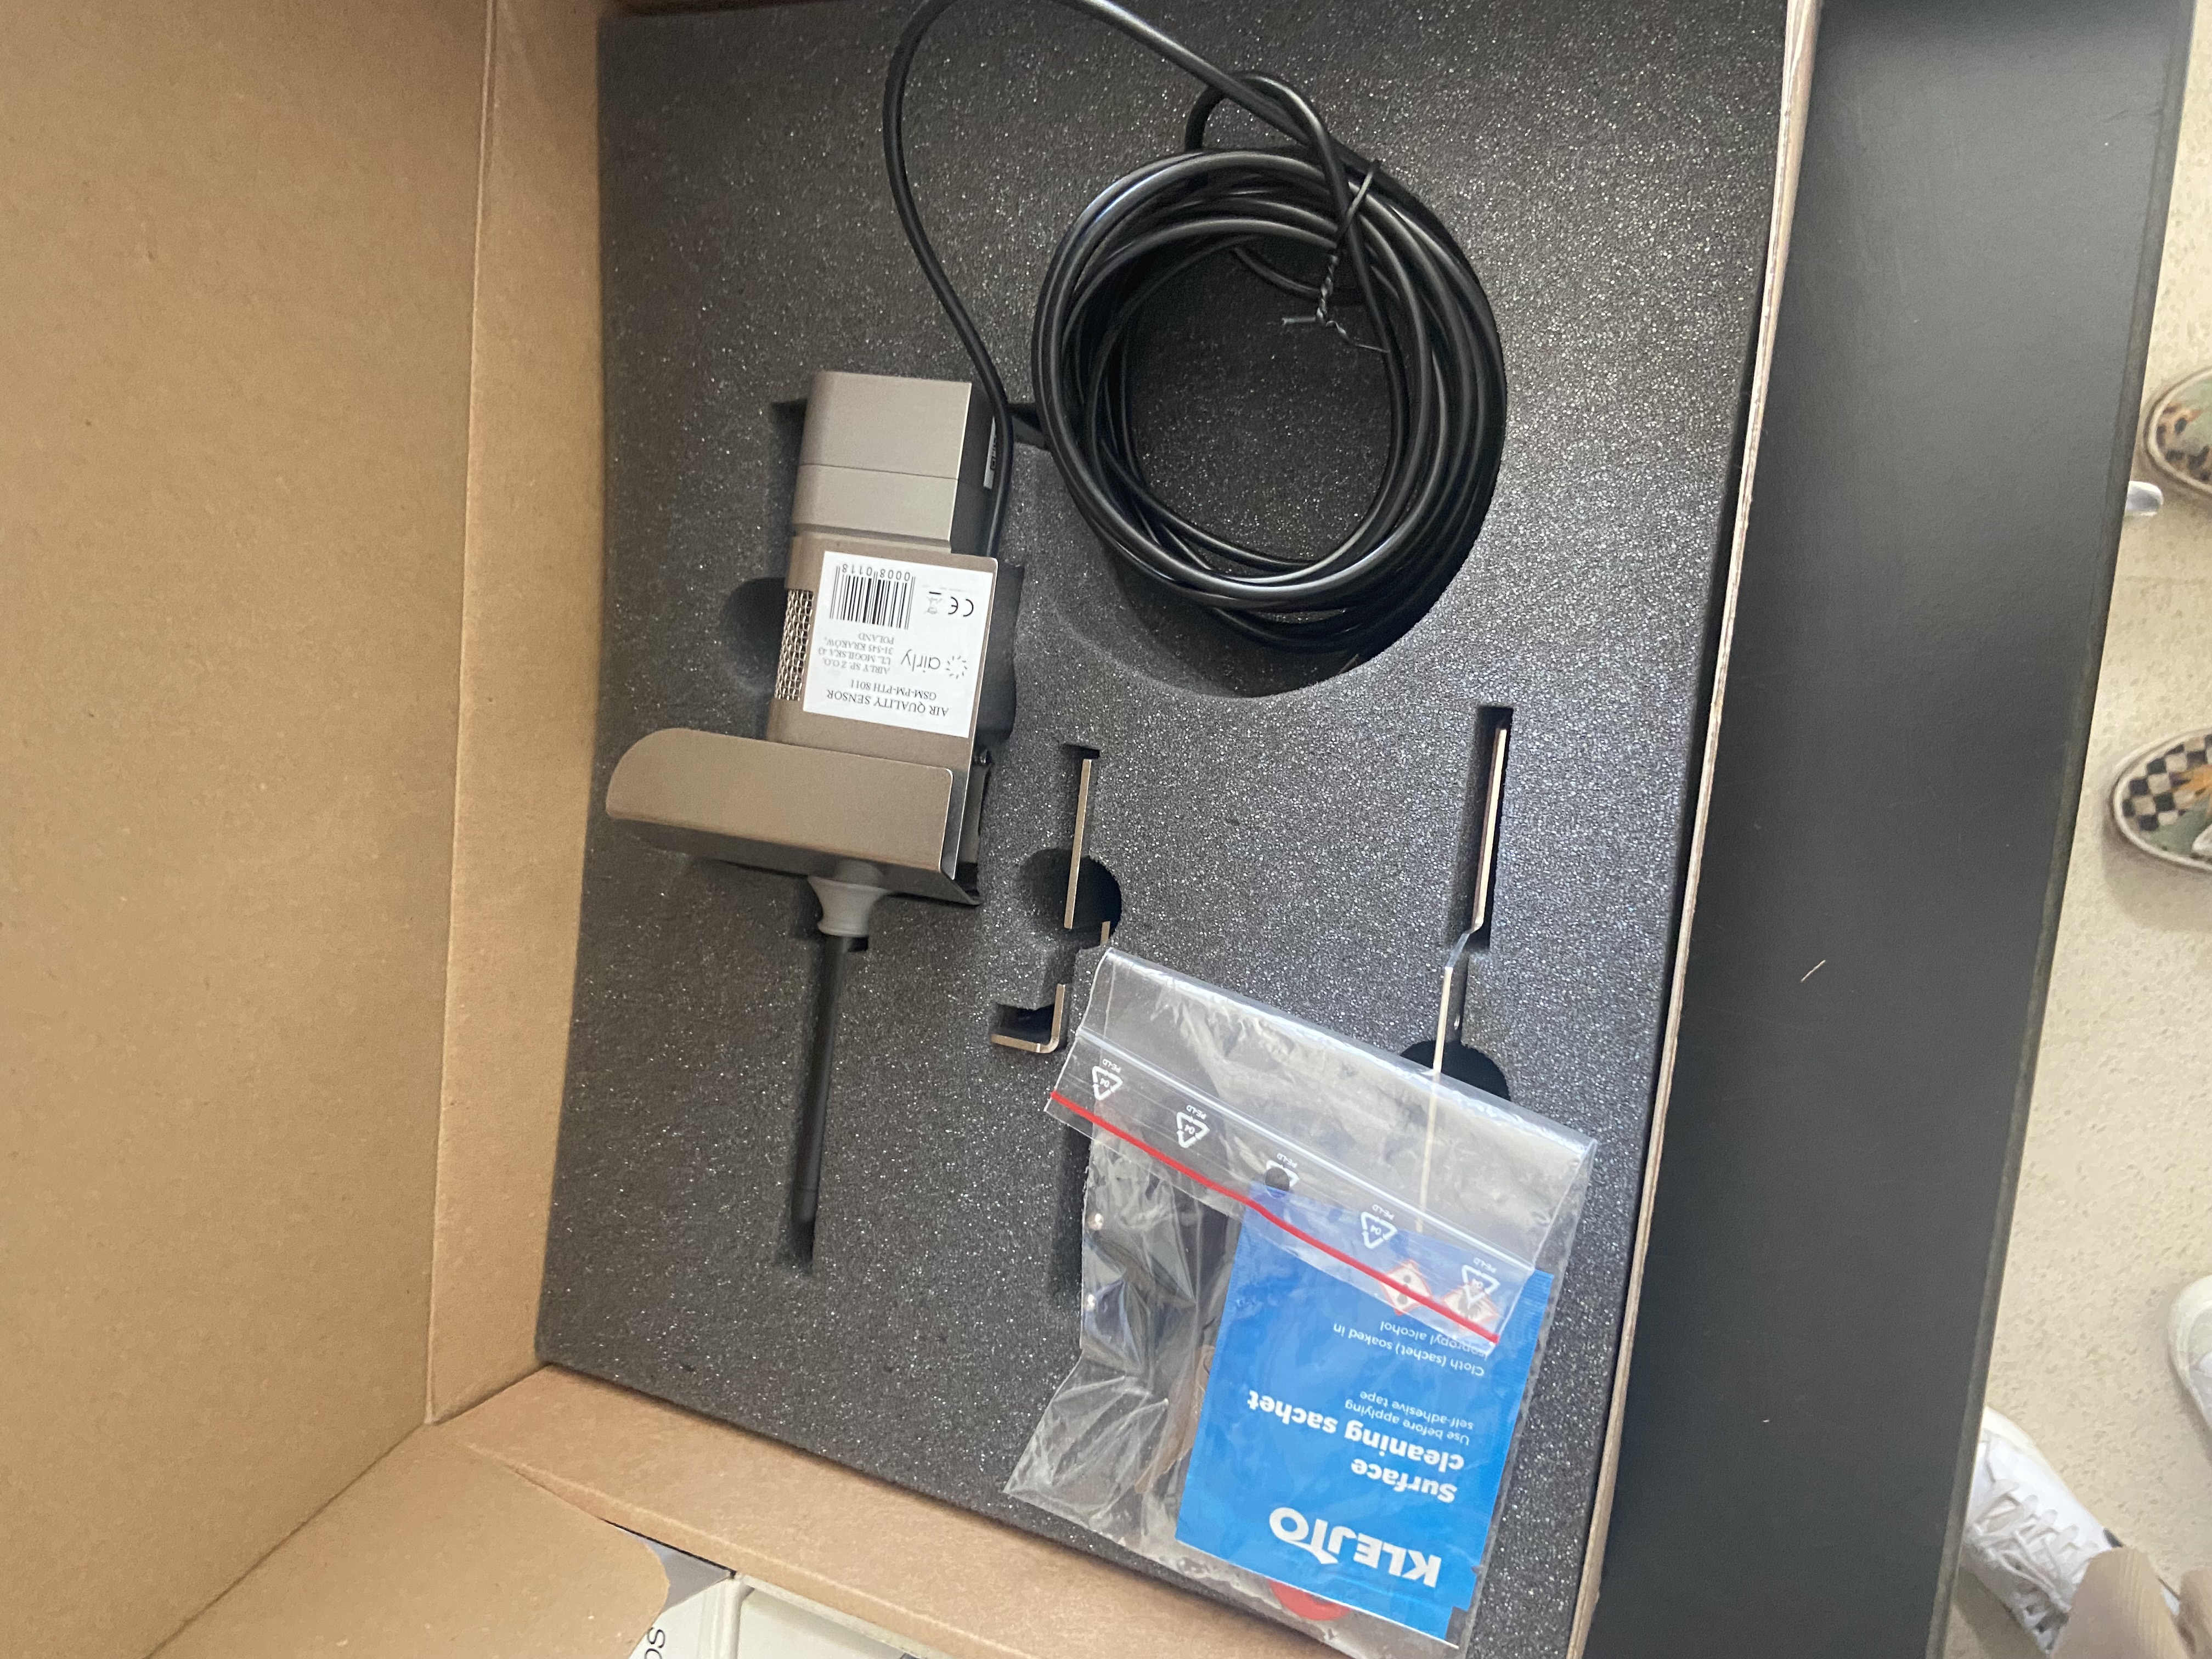
The Airly Sensors
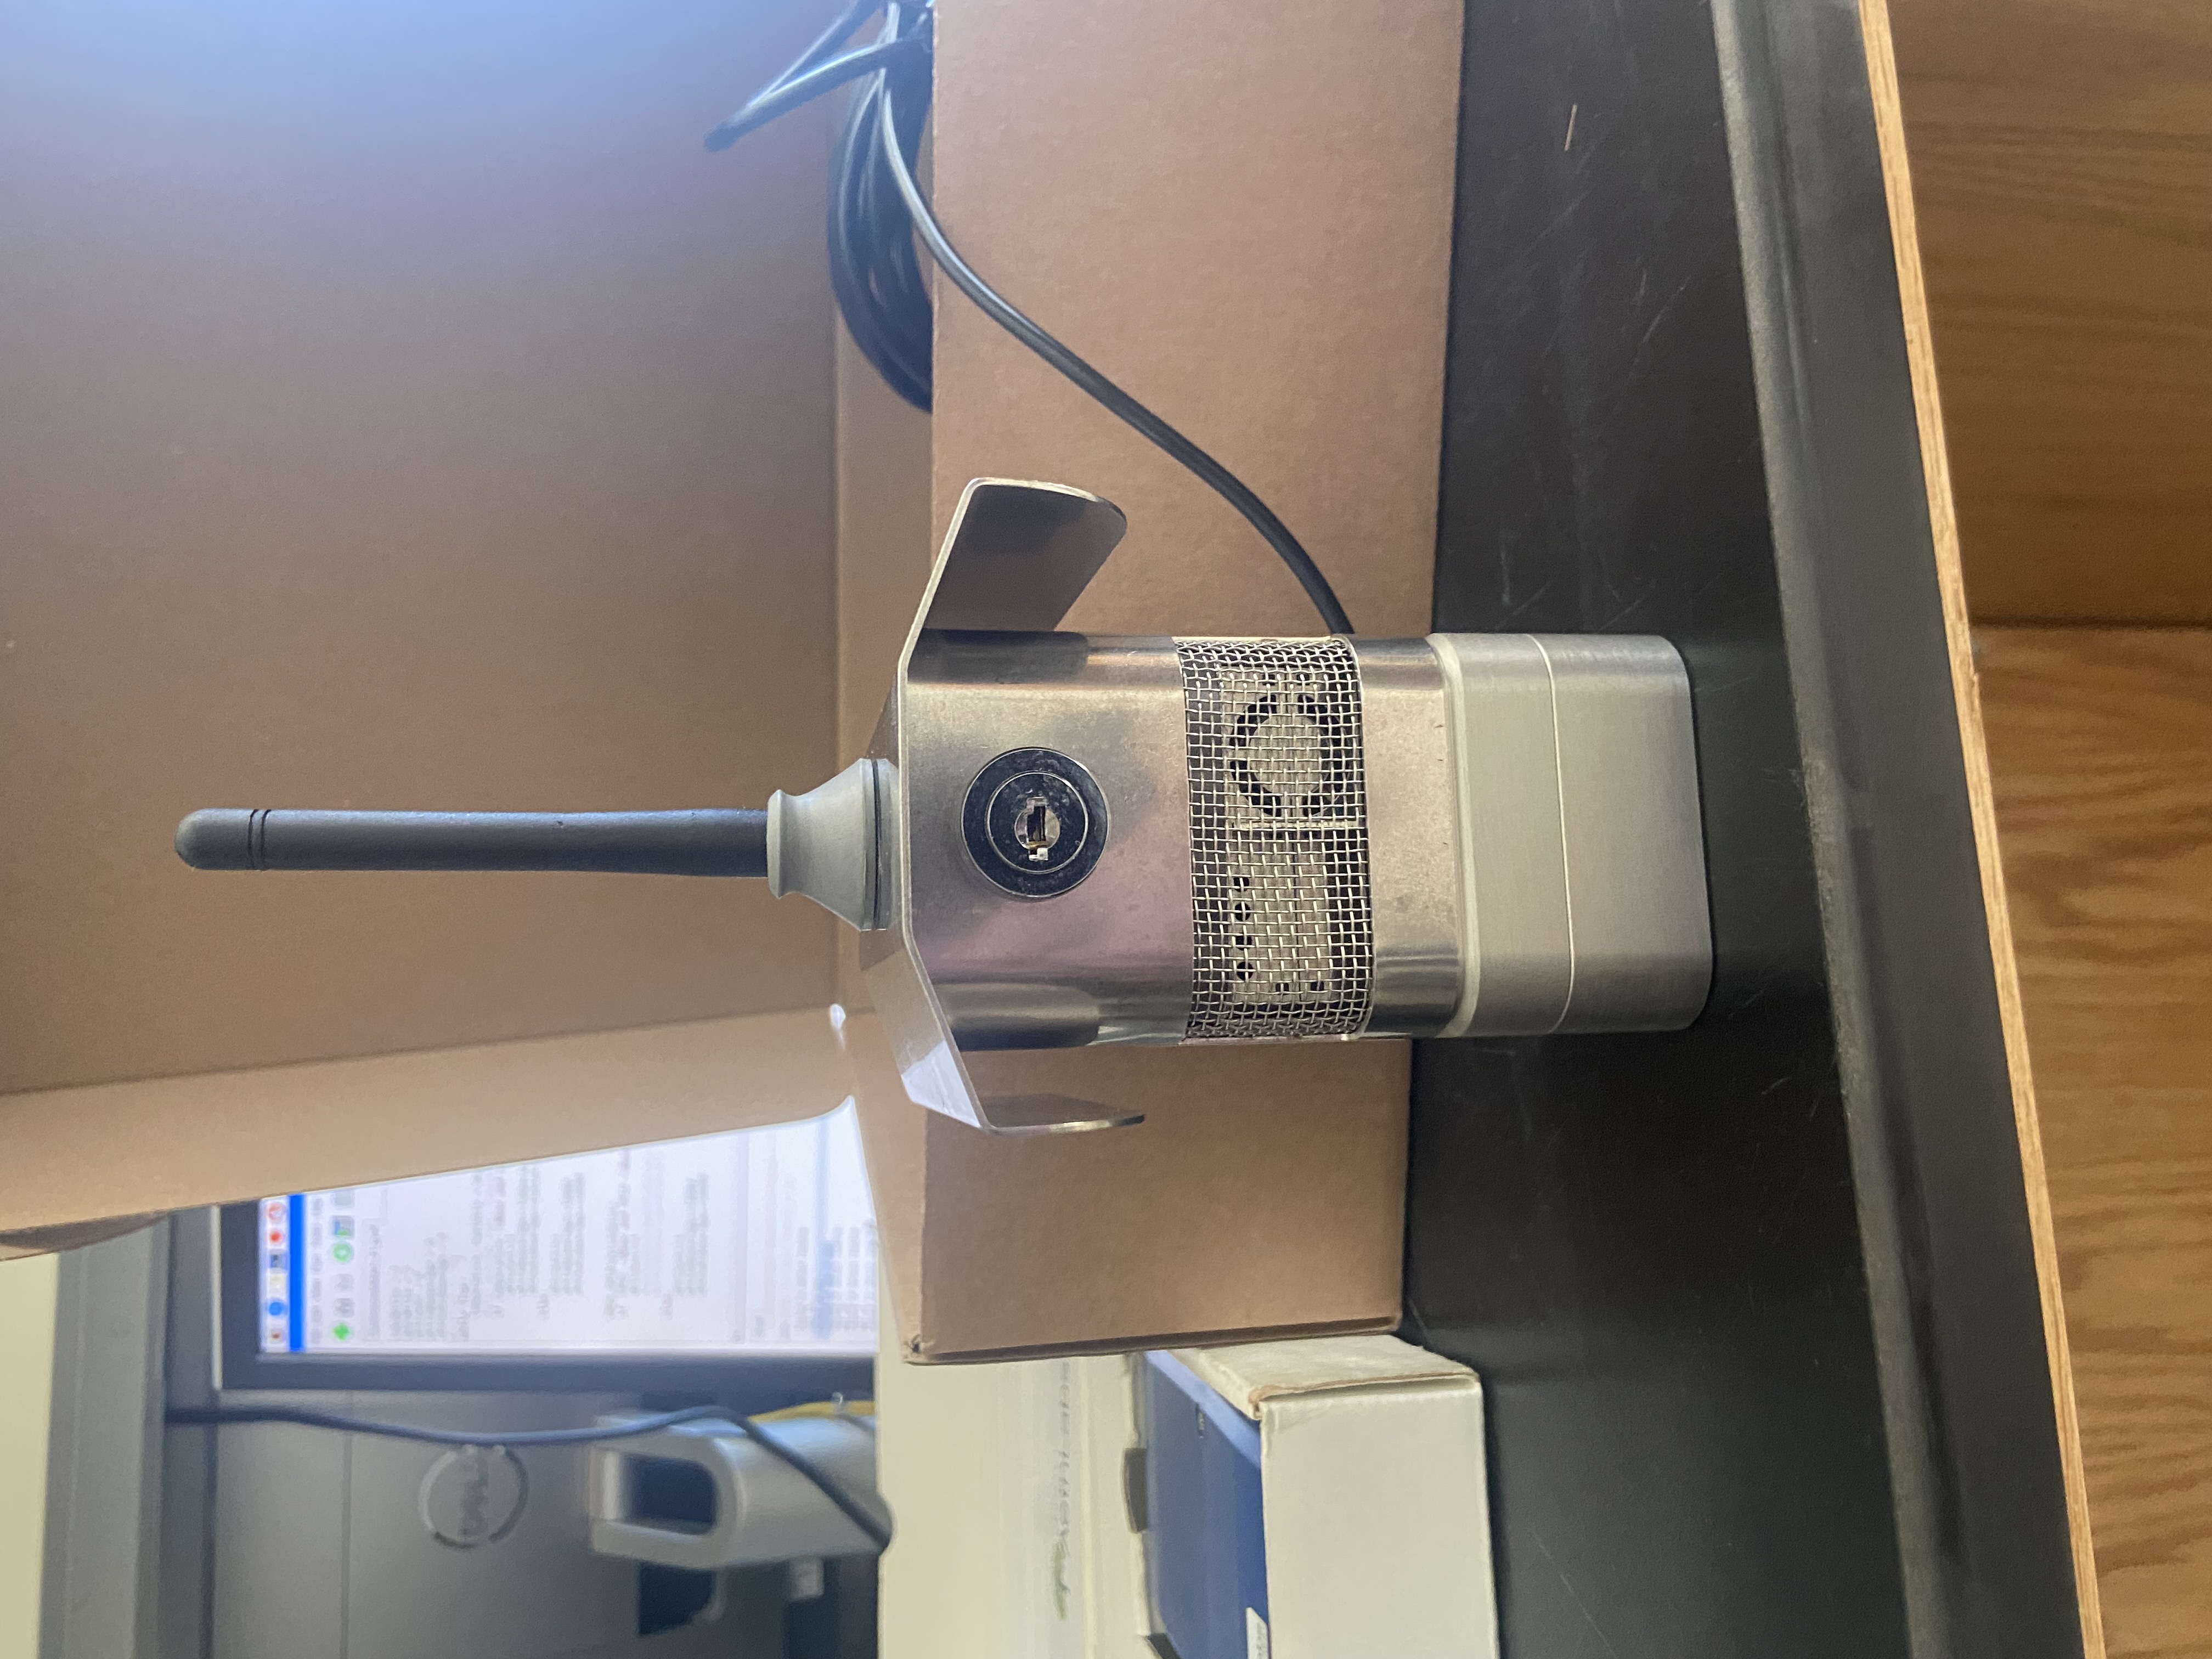
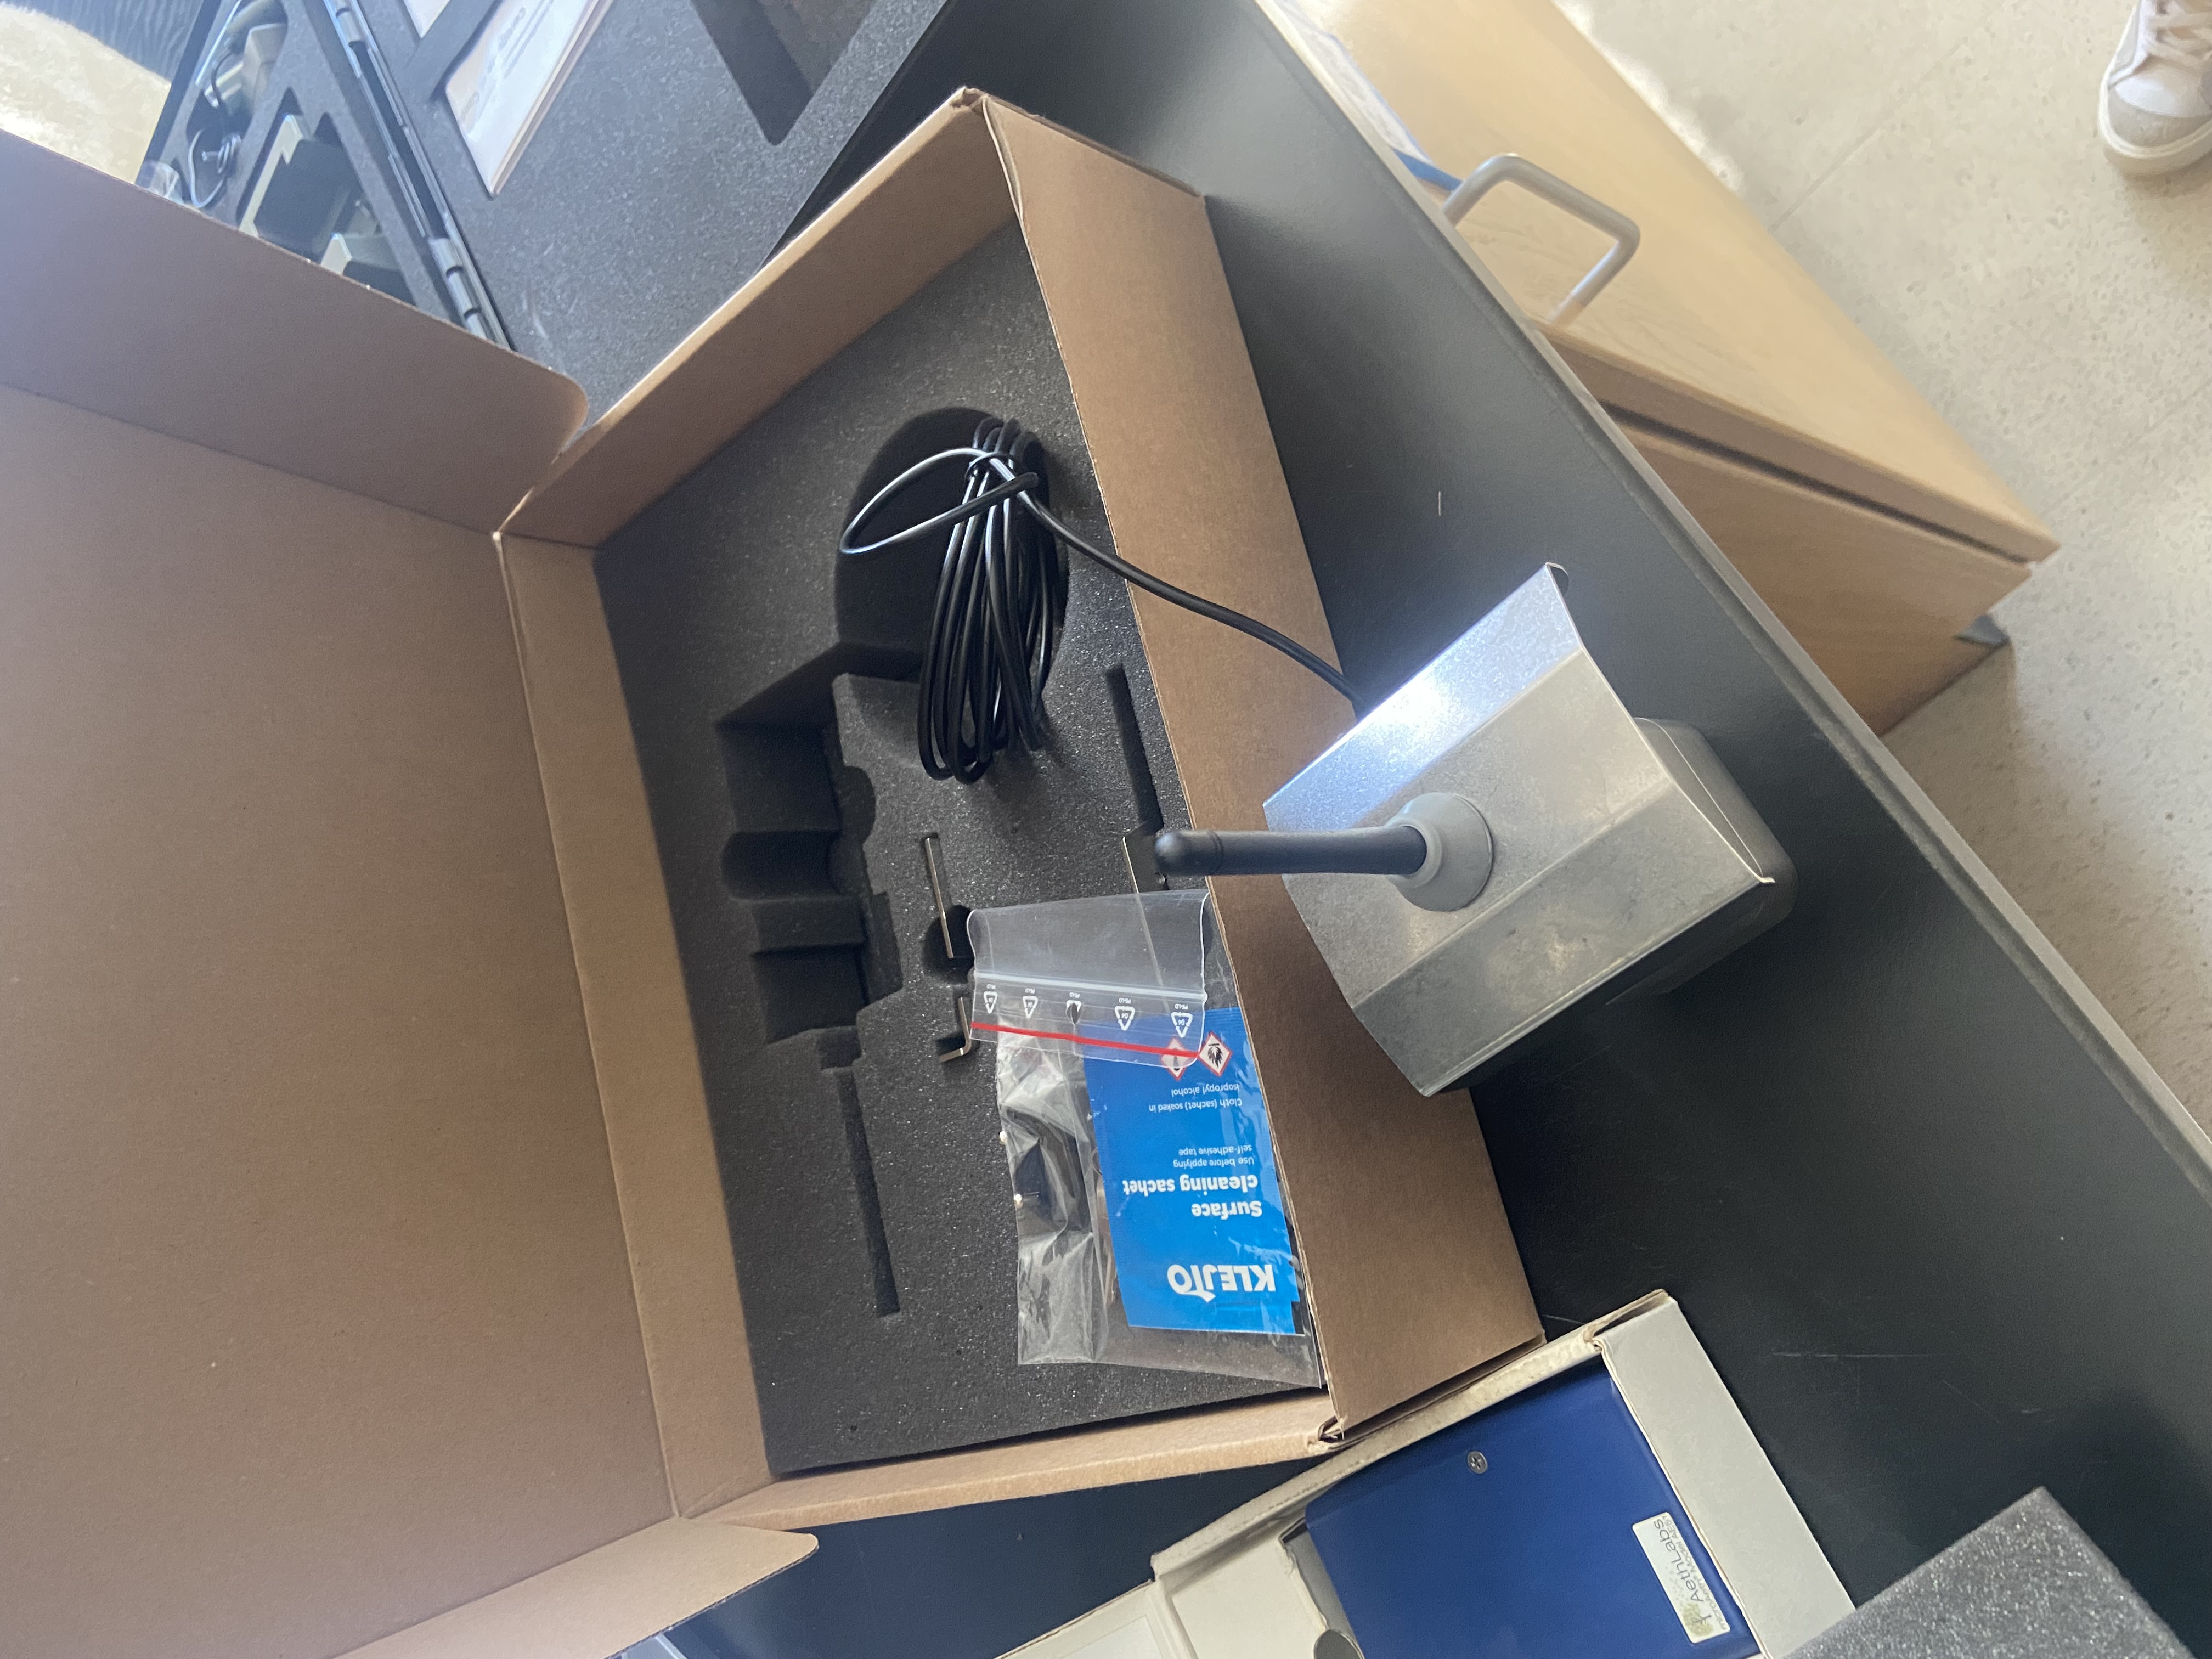
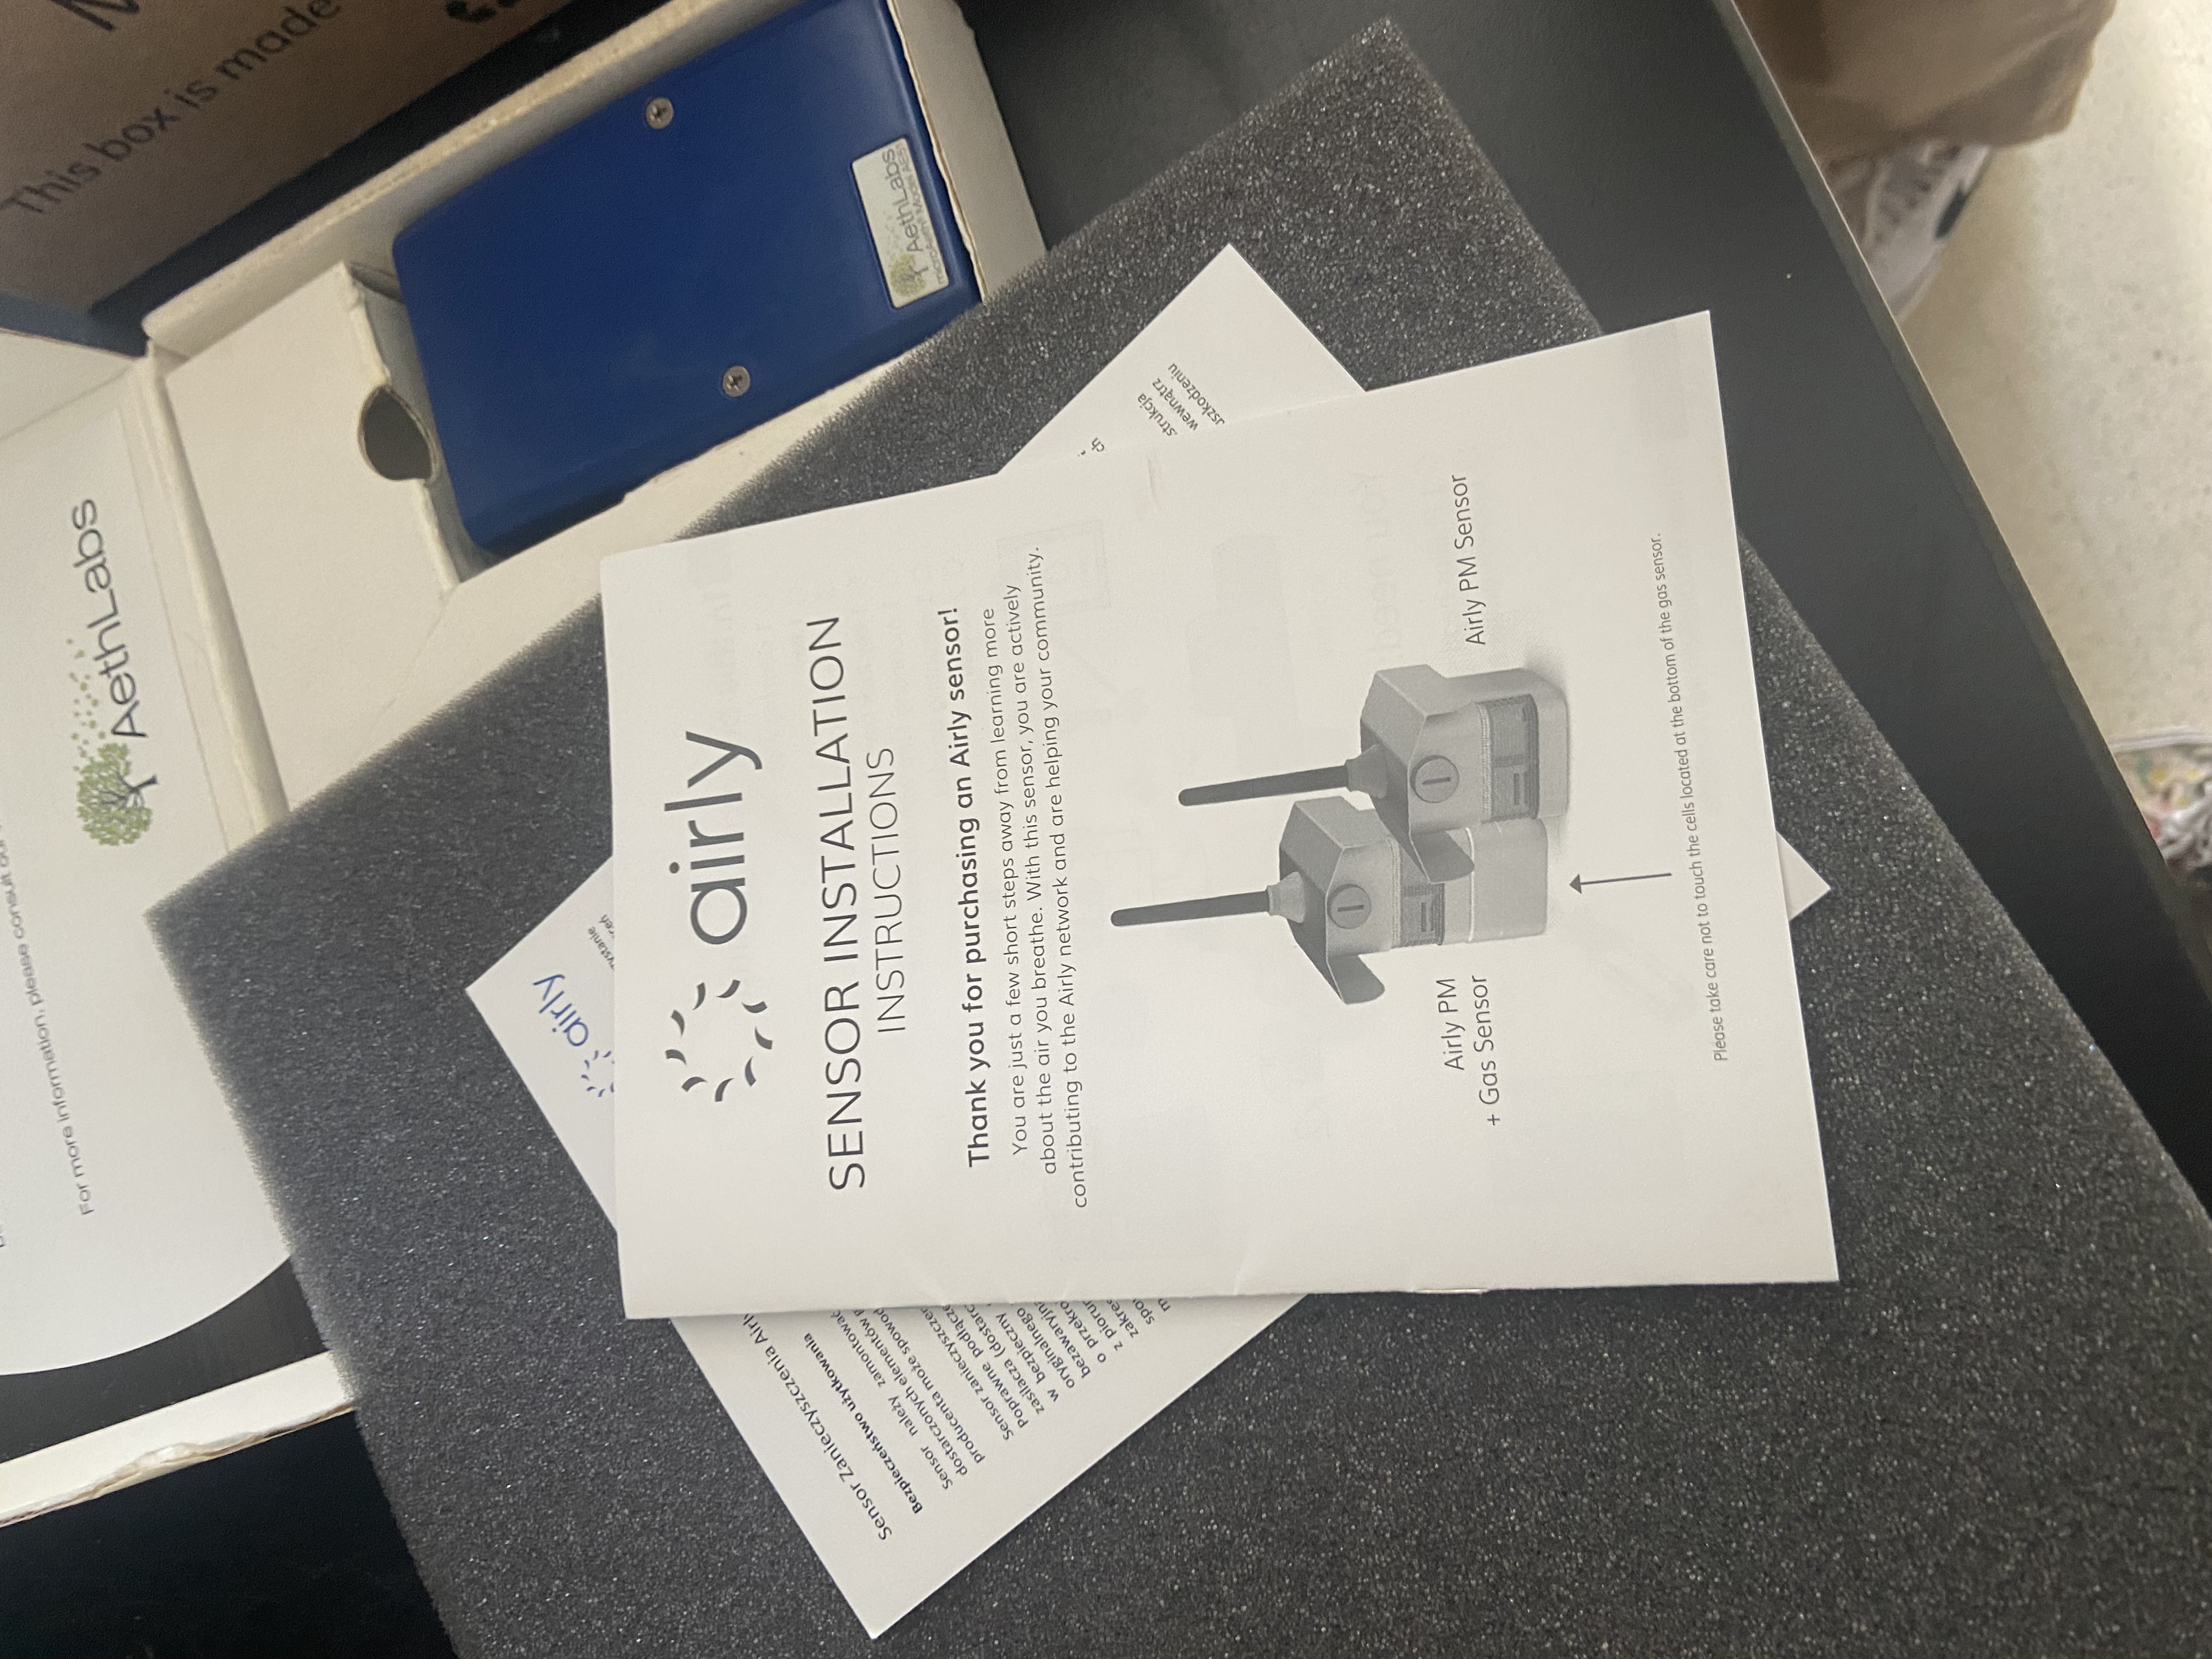
- As apart of our outreach project we began employing the Airly PM+Gas Type 1 sensors. These sensors allow for the detection of Particulate matter 1, 2.5 and 10 (denoting the size of the particles) as well as NO2 and O3 (nitrogen dioxide and ozone). The kit as seen below comes with the following items:
- Two mounting holds
- Power cable
- Disinfecting surface wipes
- A user manual
- The Airly sensor (dependant on which model was purchased)
Our Low Cost Sensor Set-Up Guide
Why Do We Care About Air Quality?
Exposure to pollution can affect everyone's health. When you breathe in air, pollution aloft in the air can enter your lungs and blood stream. This can cause averse health effect or worsen pre-exisintg medical conditions such as asthma. This is why we measure air quality, to know the day-to-day risk of being outside. There are several ways we measure air quality, all of which use technology. Government air quality monitors are decidedly the most accurate and trusted ways to measure air quality. All reported measures of air quality (on say your phone's weather app, or your preferred weather website) come from government monitors, and sensors. One downfall of government monitors is that they are few and far between. Additionally, other air quality sensors, like the one you will build using this document, are useful for staying safe and informing ourselves on the local level. We can use less accurate, but more accessible sensors to inform our daily decisions. For more information visit our info page: https://www.airemory.com/info.html
Background
In March 2021, a few of the Air Emory team led an event alongside the Atlanta Science Festival. The event was a small "air quality scavenger hunt" and it required participants to use a handheld air quality sensor and take readings at different, secret, locations around old fourth ward park. The event was designed to give those without much experience in air quality testing and general knowledge in air quality a look into our world. To further this outreach, we decided it would be fun to give people the chance to make their own at home air quality sensors, exactly like the ones we used at the event.
Below is documentation of the components used and their arrangement for the sensors we used during the 2021 Atlanta Science Festival. A small computer, called an Arduino, was used to process data collected by the laser particle sensor. This data was then displayed on a small LCD display.
The measurements taken and shown were as follows:
Measurements
- EPA Air Quality Index (On a scale from Good-Harmful)
Moderate - PM2.5 Concentration
17
Here is a list of of EPA AQI levels and their equivalent PM2.5 concentration levels:
- Example: AQI Category
Index Values, PM Concentration - Good
0-50, 0.0-12.0 - Moderate
51-100, 12.1-35.4 - Unhealthy for Sensitive Groups
101-150, 35.5-55.4 - Unhealthy
151-200, 55.5-150.4 - Very Unhealthy
201-300, 150.5-250.4 - Hazardous
>301, >250.5
Materials
To build the low-cost sensor used at the Atlanta Science Festival the following materials will be needed:
- Arduino Kit
- Laser Particle Sensor
- Laptop or monitor
Some things to note: You do not have to use these links but the Arduino Kit above does come with a breadboard, wires, LCD display, 9V battery, USB cable and rubber bands. These are just a few trusted links found by the lab. If you are looking for a different LCD display make sure you find one with a soldered header (https://www.adafruit.com/product/1447). We will not provide explaination for how to solder your electronics.
Set-up
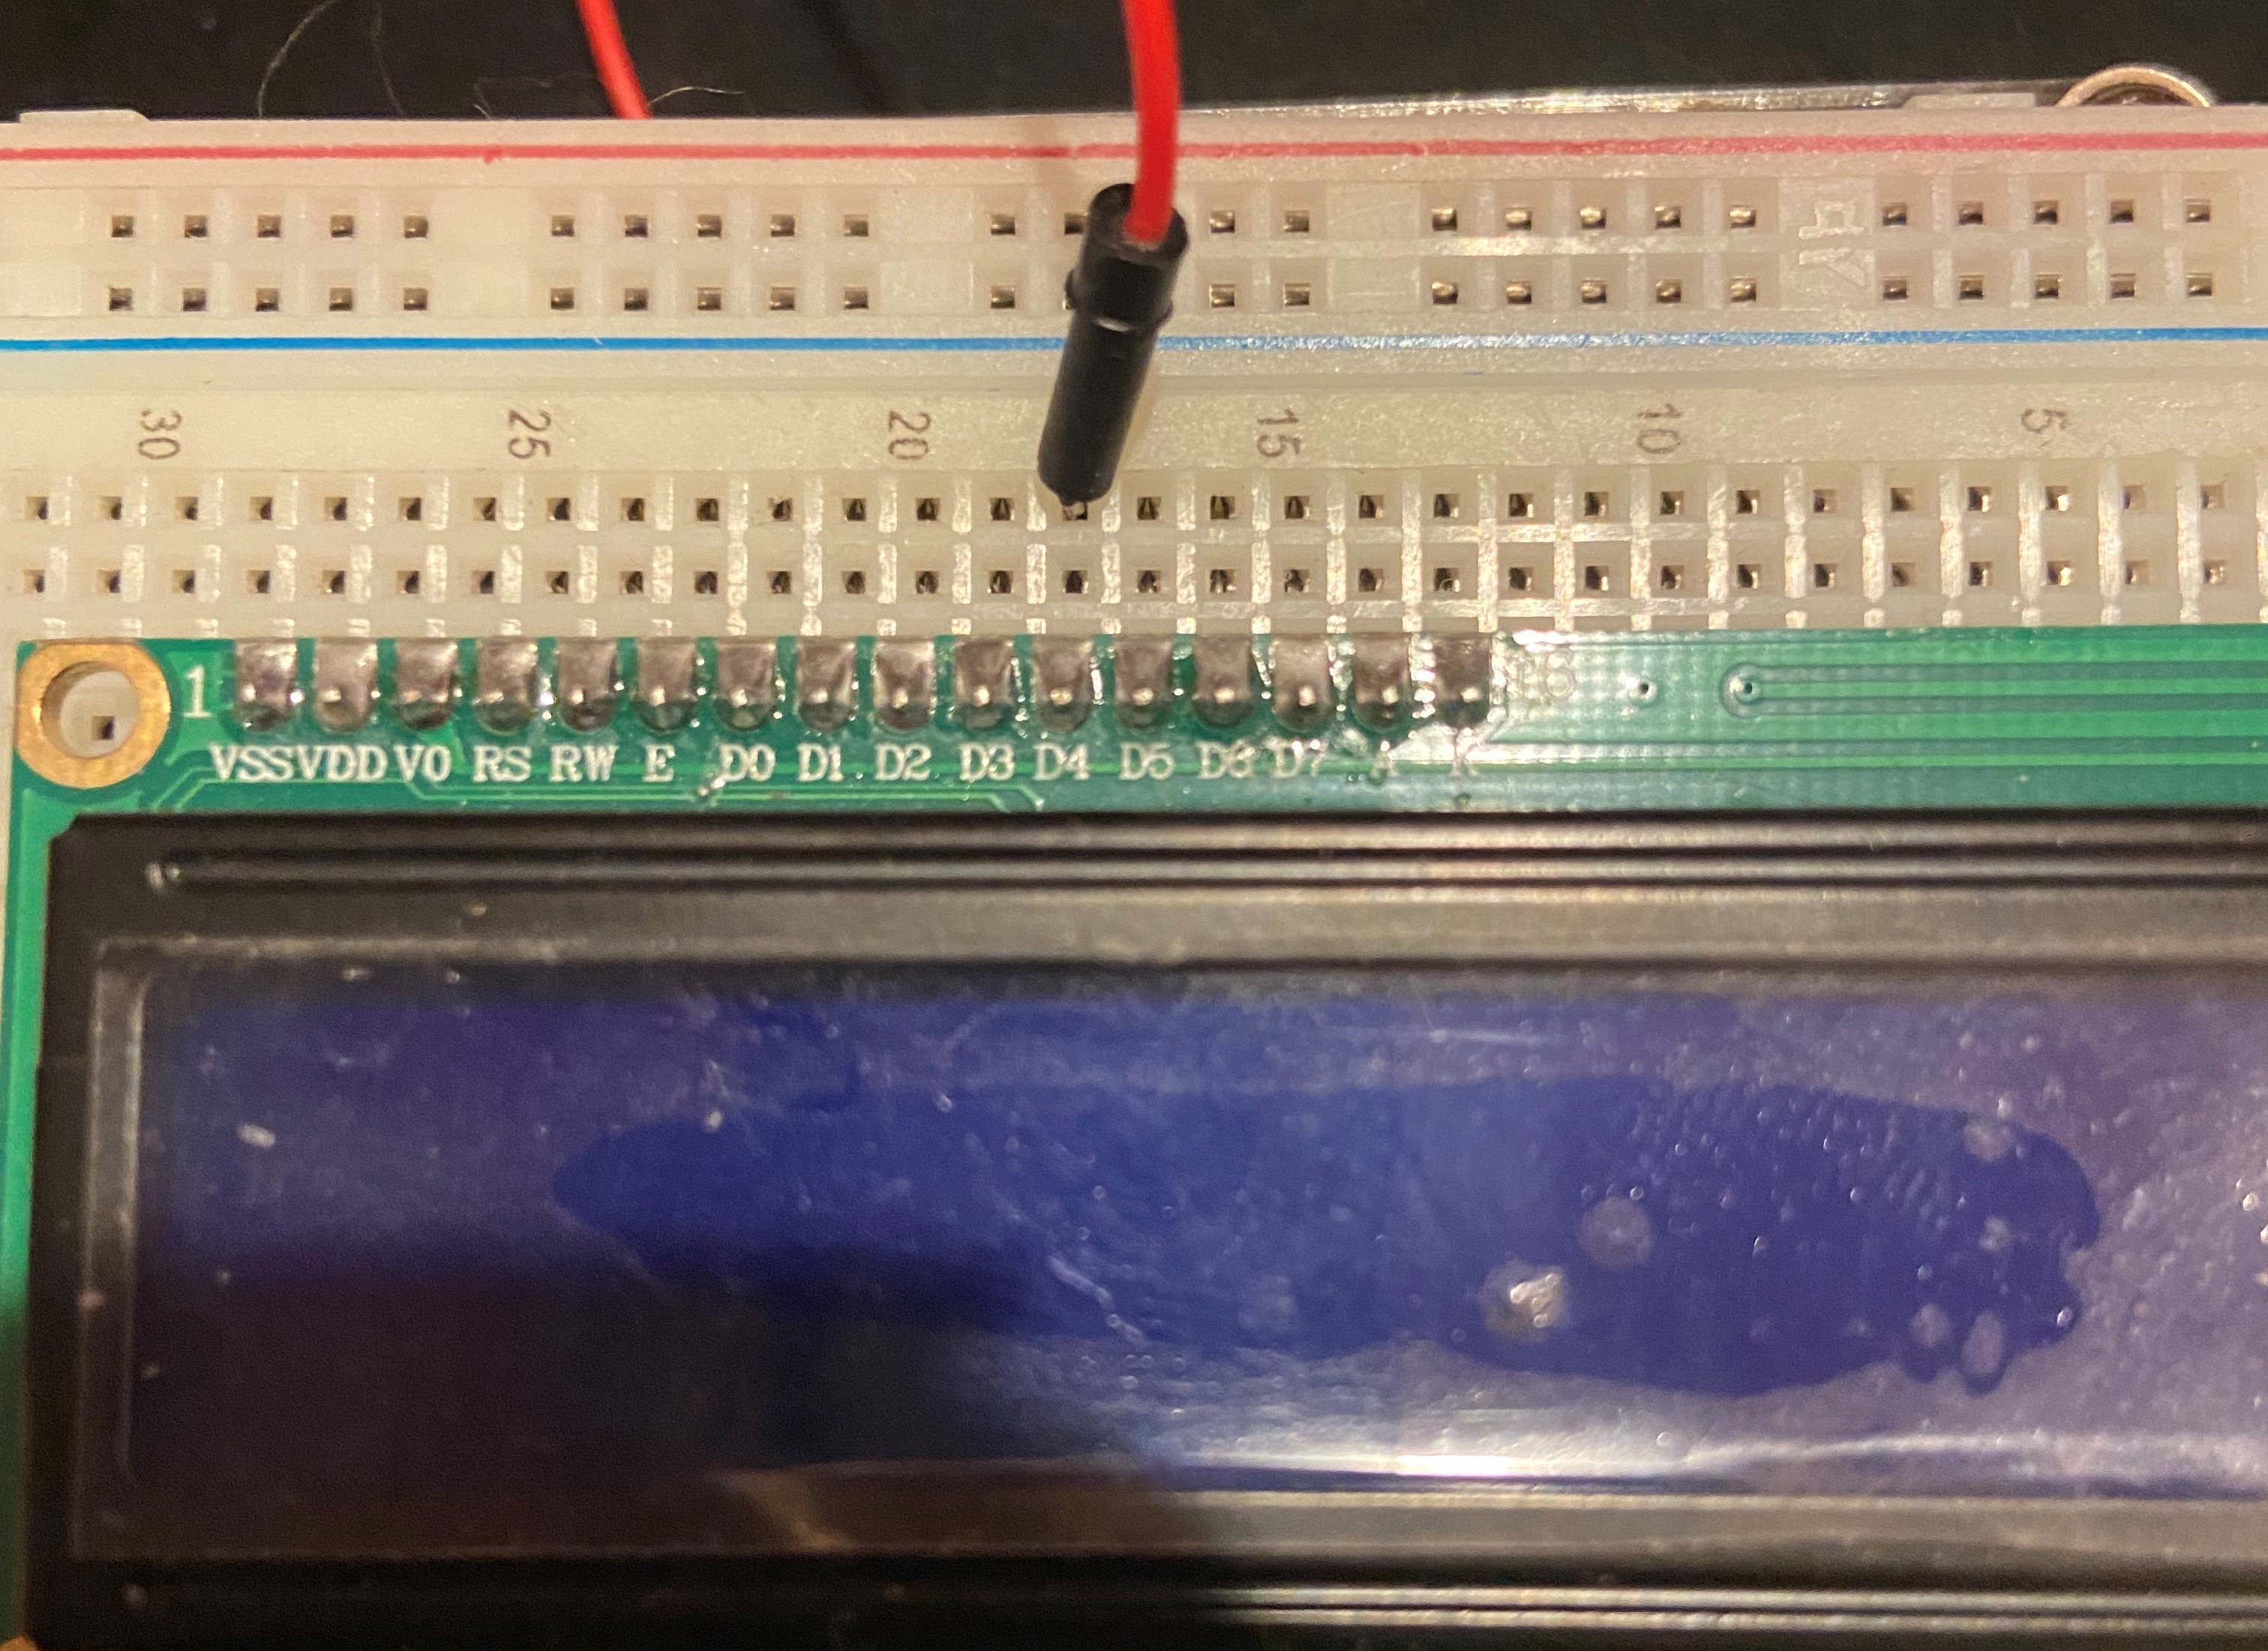
Set-up for the sensor is as follows: Make sure you have all necessary components (links for purchase can be found above), laser particle sensor, Arduino, breadboard, LCD display, wire packet, battery. The following image can be used as a guide for sensor assembly (but a step-by-step guide can be found below if you do not want to try the asembly on your own). The wire column indicates the wire color we used (although colors are arbitrary so do not fret over this), the second column indicates what you are connecting and where on the breadboard one must initially insert the wire. The third column indicates what you are connecting to and where the other end of the wire should be inserted.
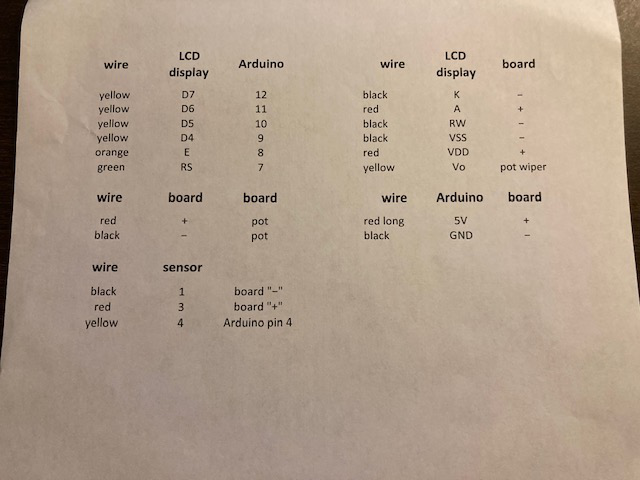
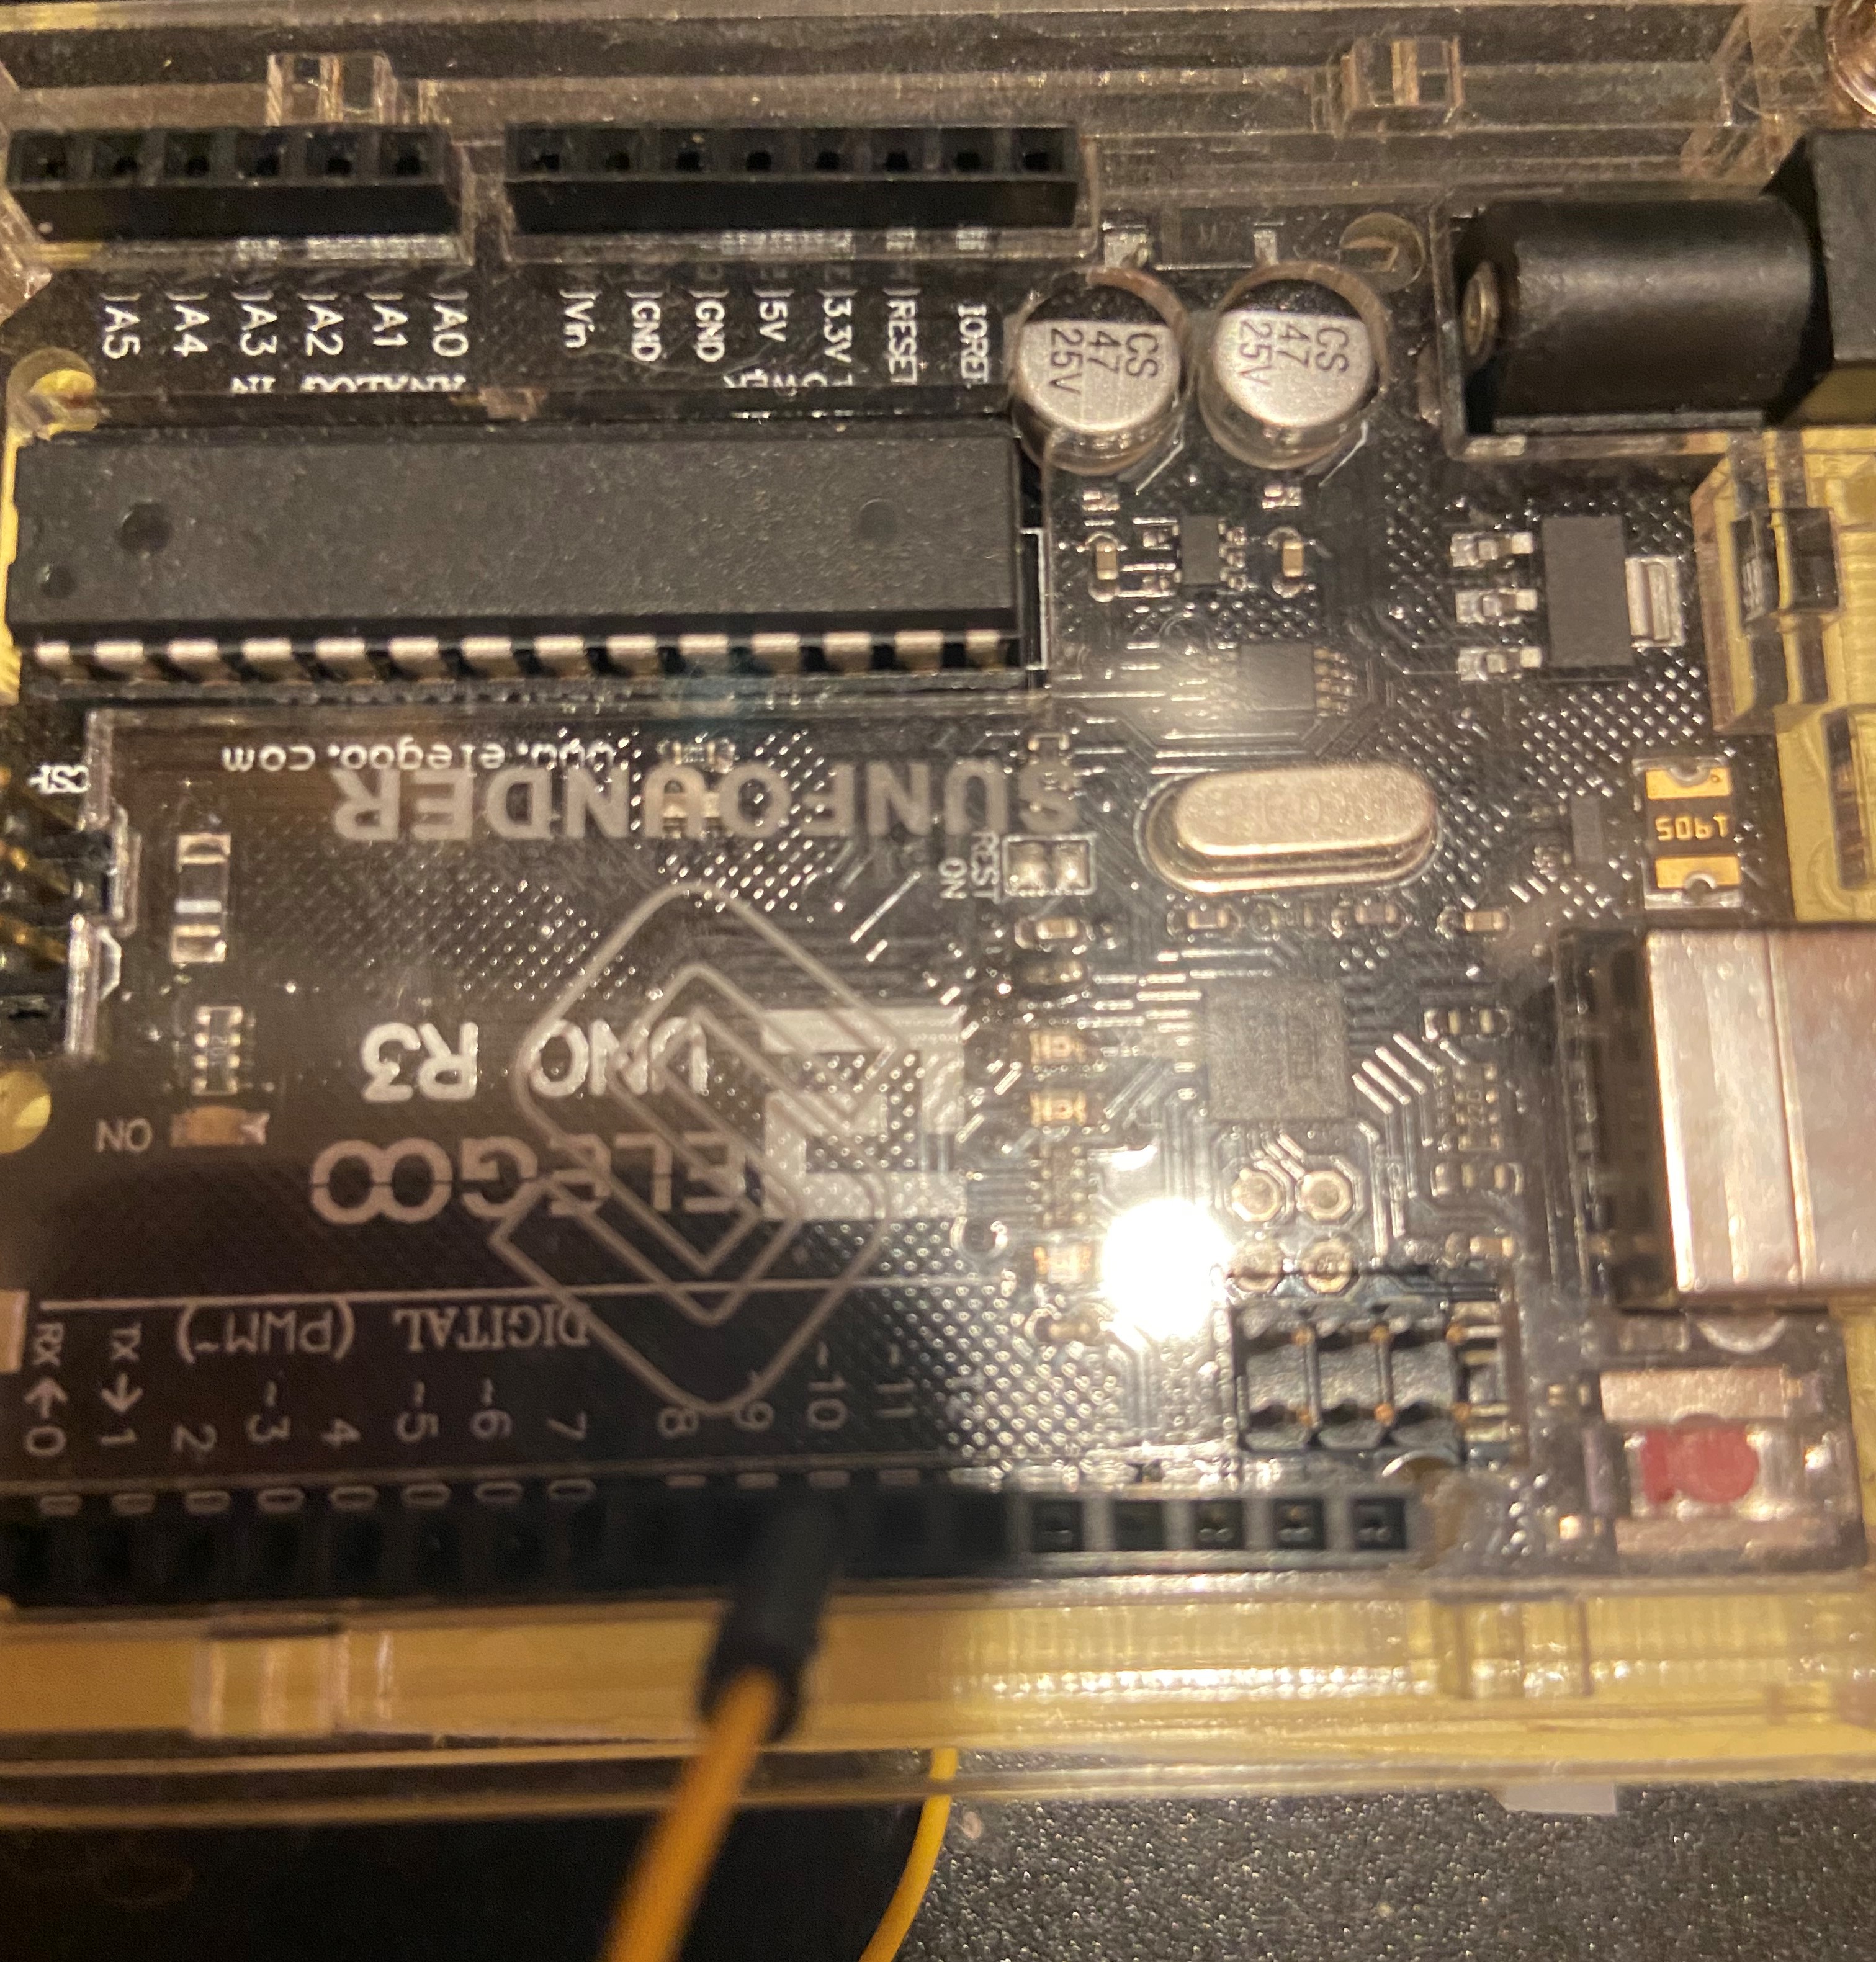
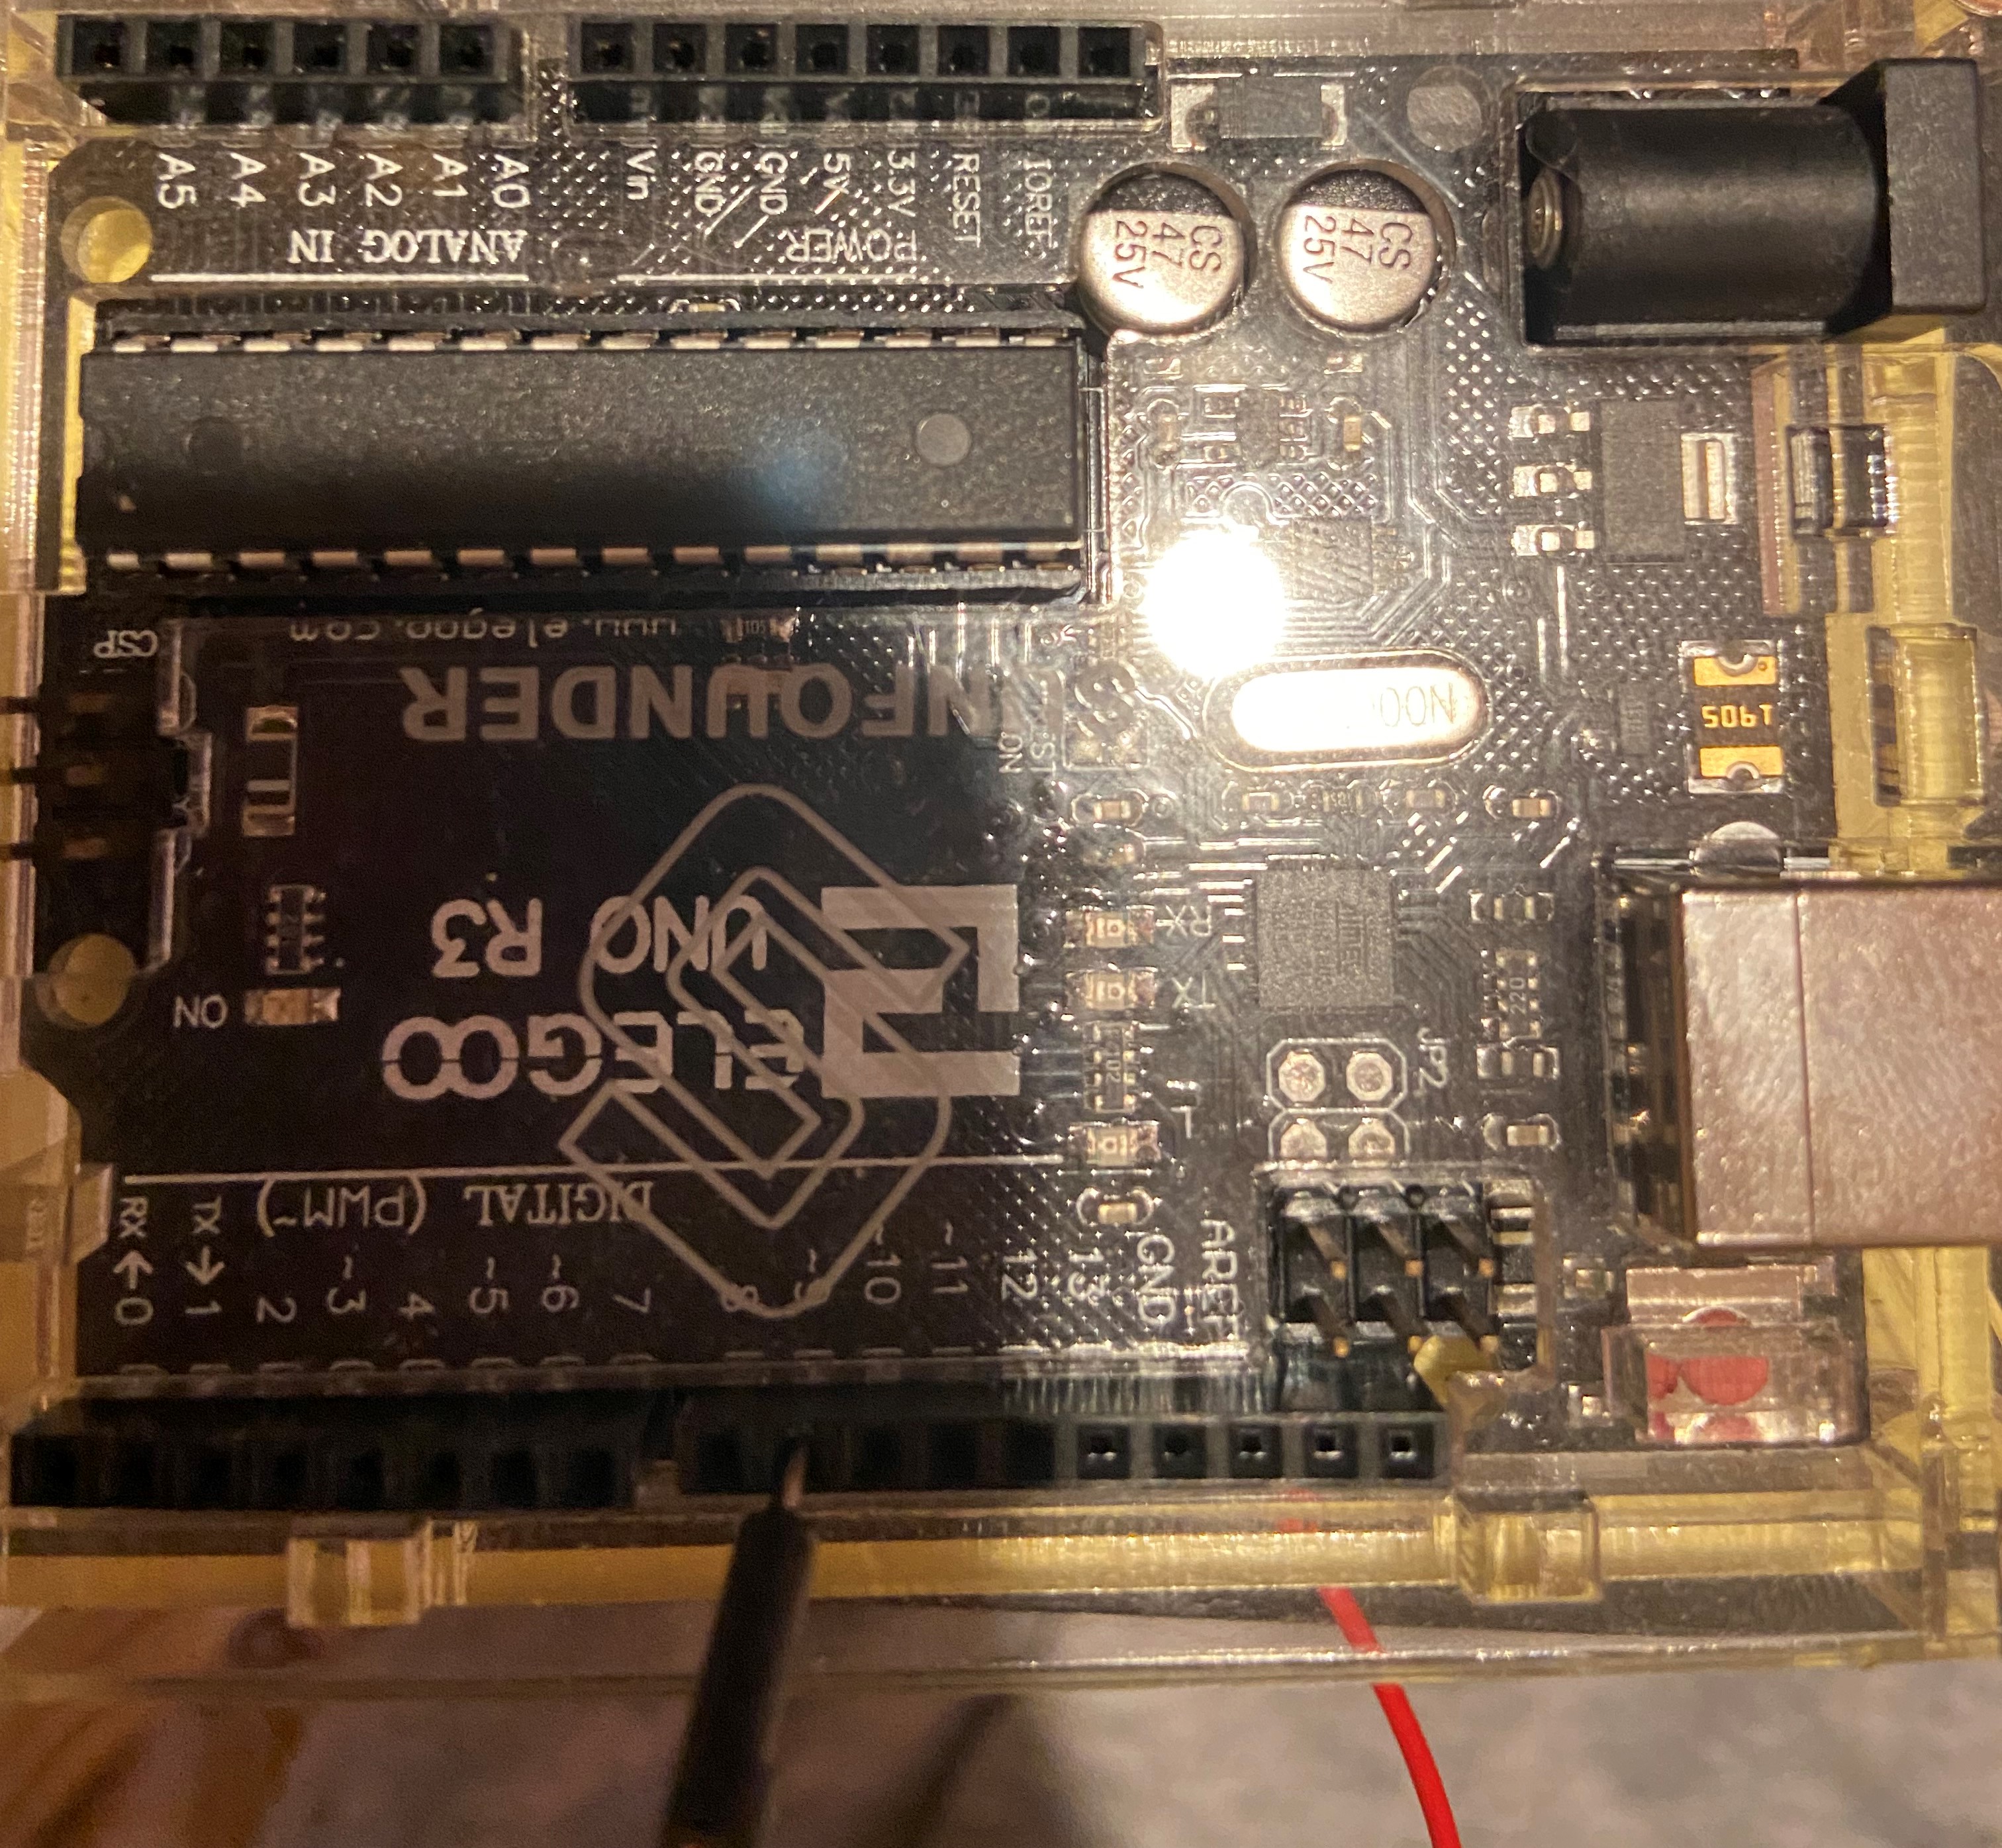
Following is a step-by-step guide to setting up your low-cost sensor. Follow along with the instructions to come, and you will have a sensor set-up exactly like those we use in the lab! One thing to note is that these steps do not have to be done in order. Your sensor will still operate regardless of the order you connected your wires and hardware! Additionally, most all pictures below show single wire connections. This is done to make following along easier, DO NOT disconnect the wires after connecting them. Your finished product should look like the sensor found in the photos at the end of the document!
Step-by-Step
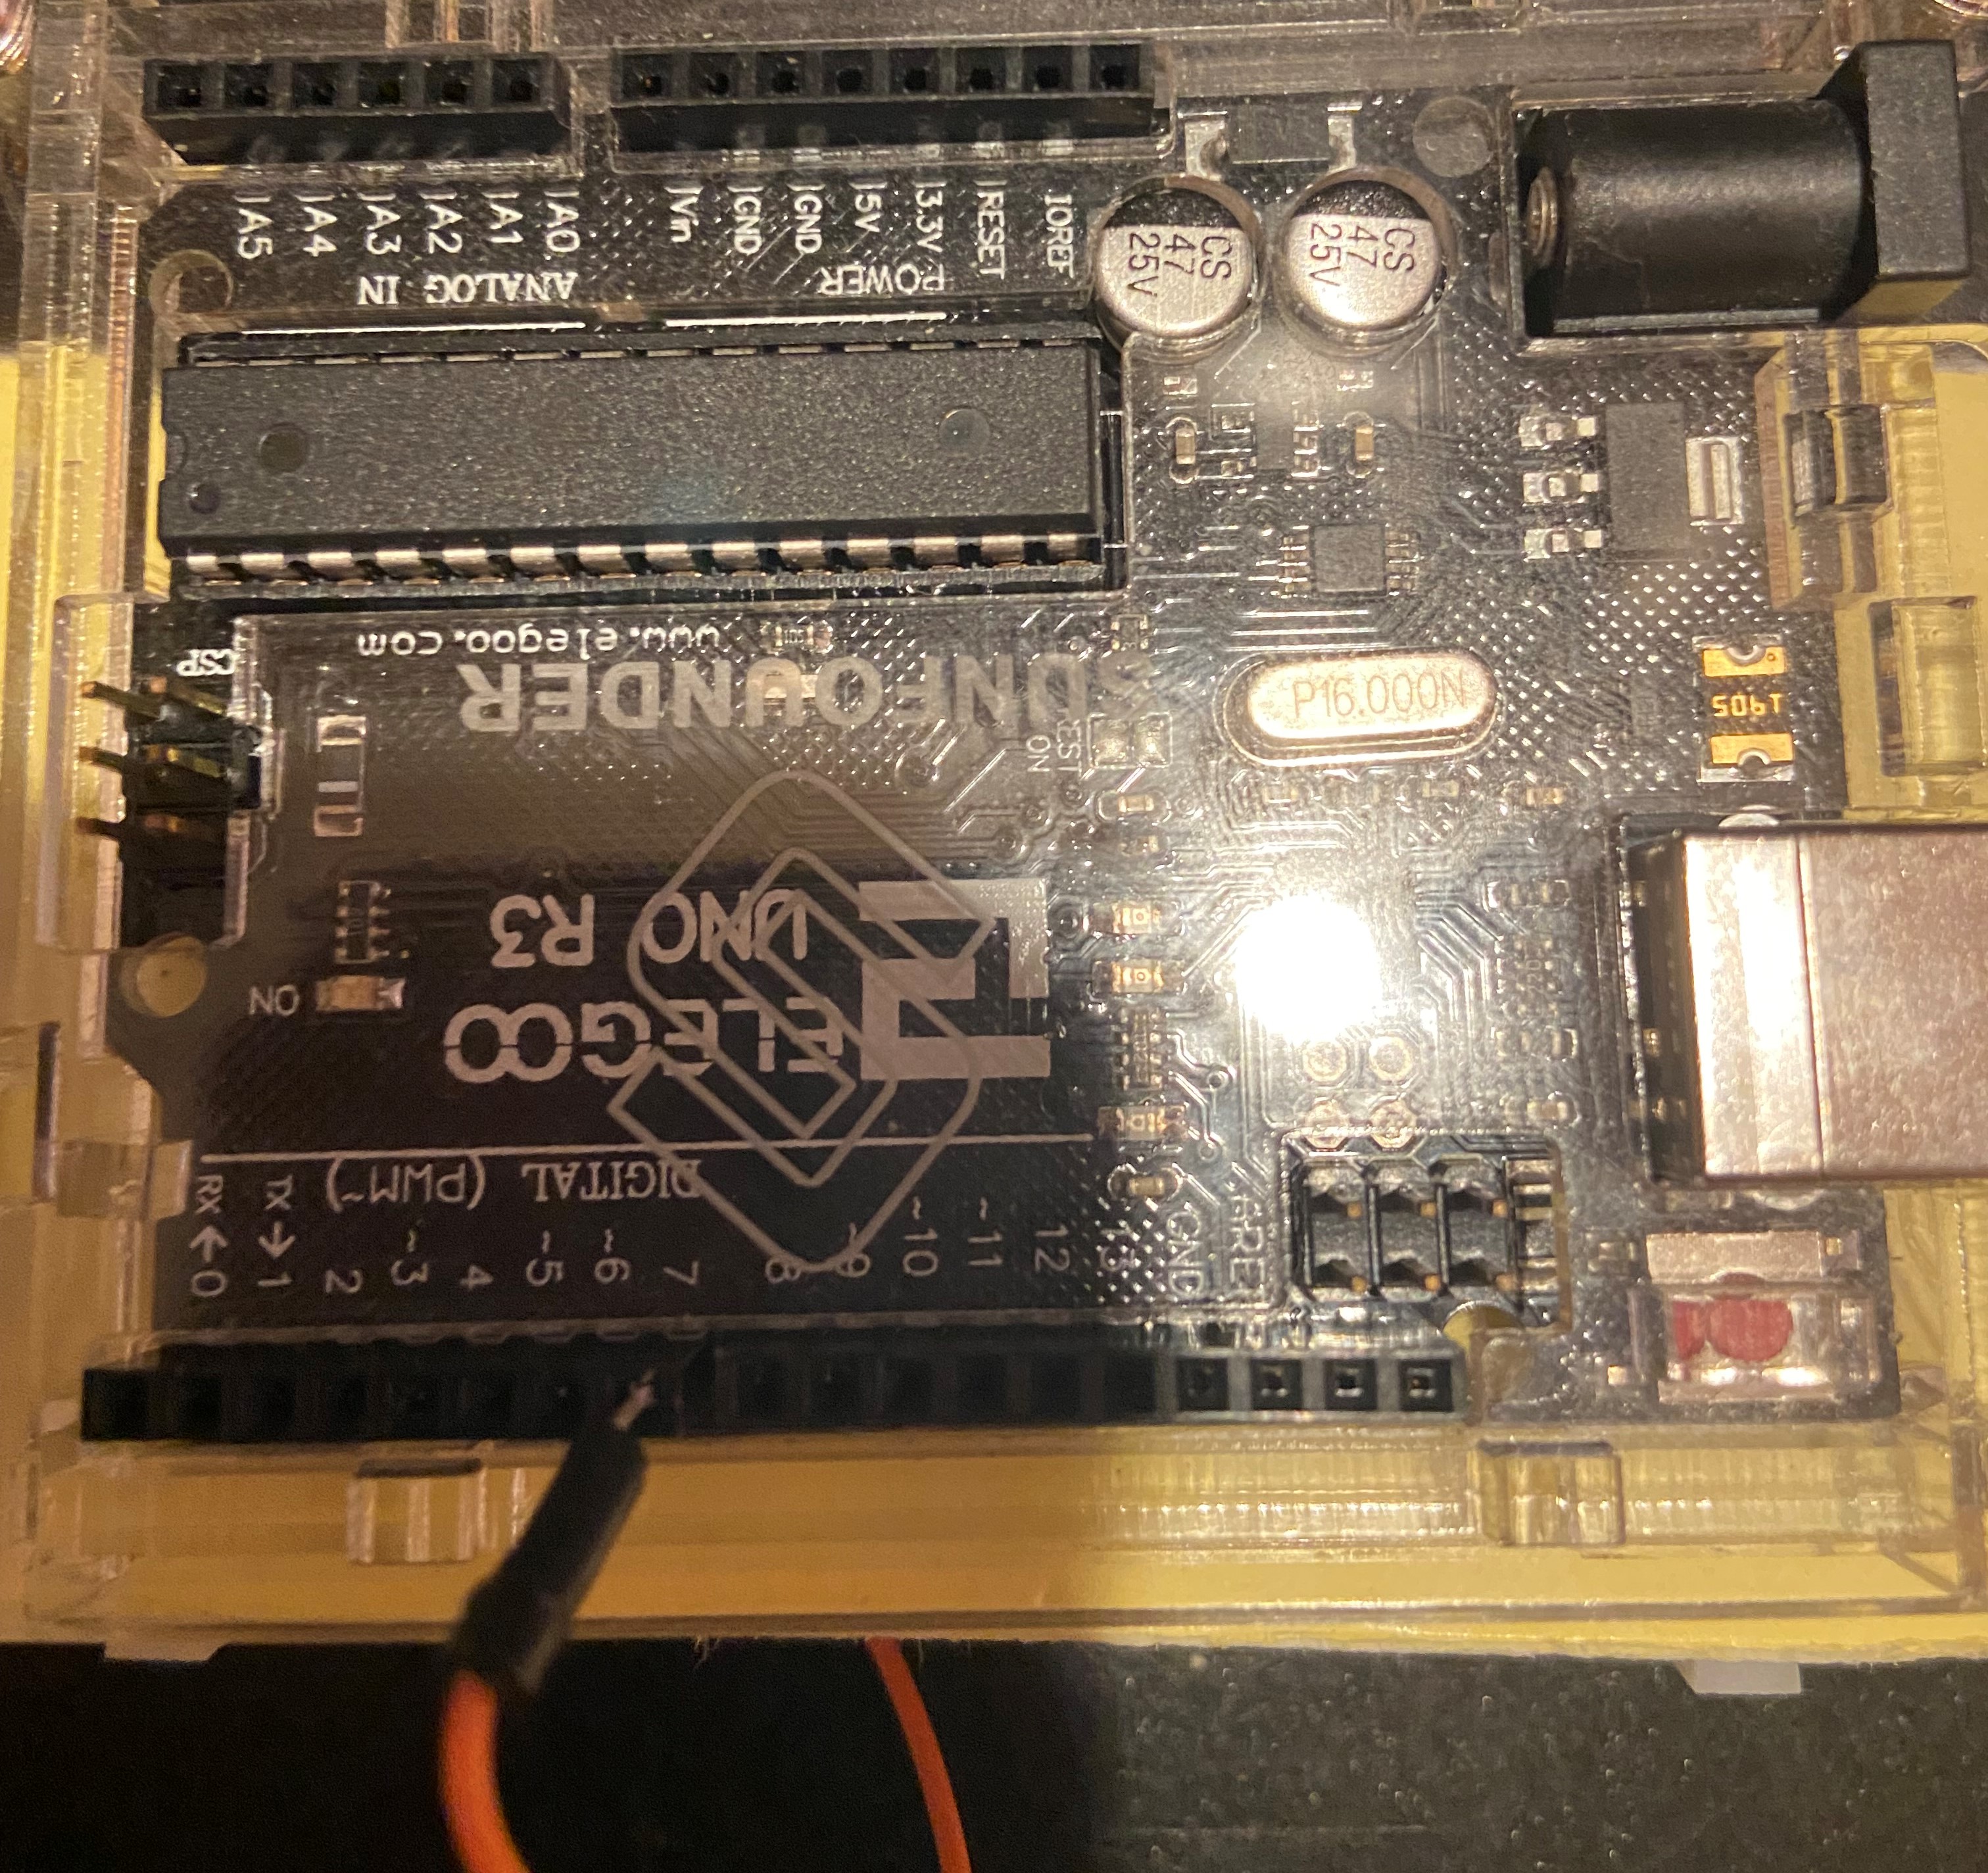
We will start by coding the LCD display to show the metrics we would like to see. To do this, connect your Arduino to a laptop or monitor via USB. Create a new workspace within the Arduino. Copy and paste the code from: https://github.com/EmoryAir/EmoryAir.github.io/blob/Low_cost_schema/documentation/PM_sensor_LCD.ino onto your workspace. Congrats! You just coded in Arduino's native language!
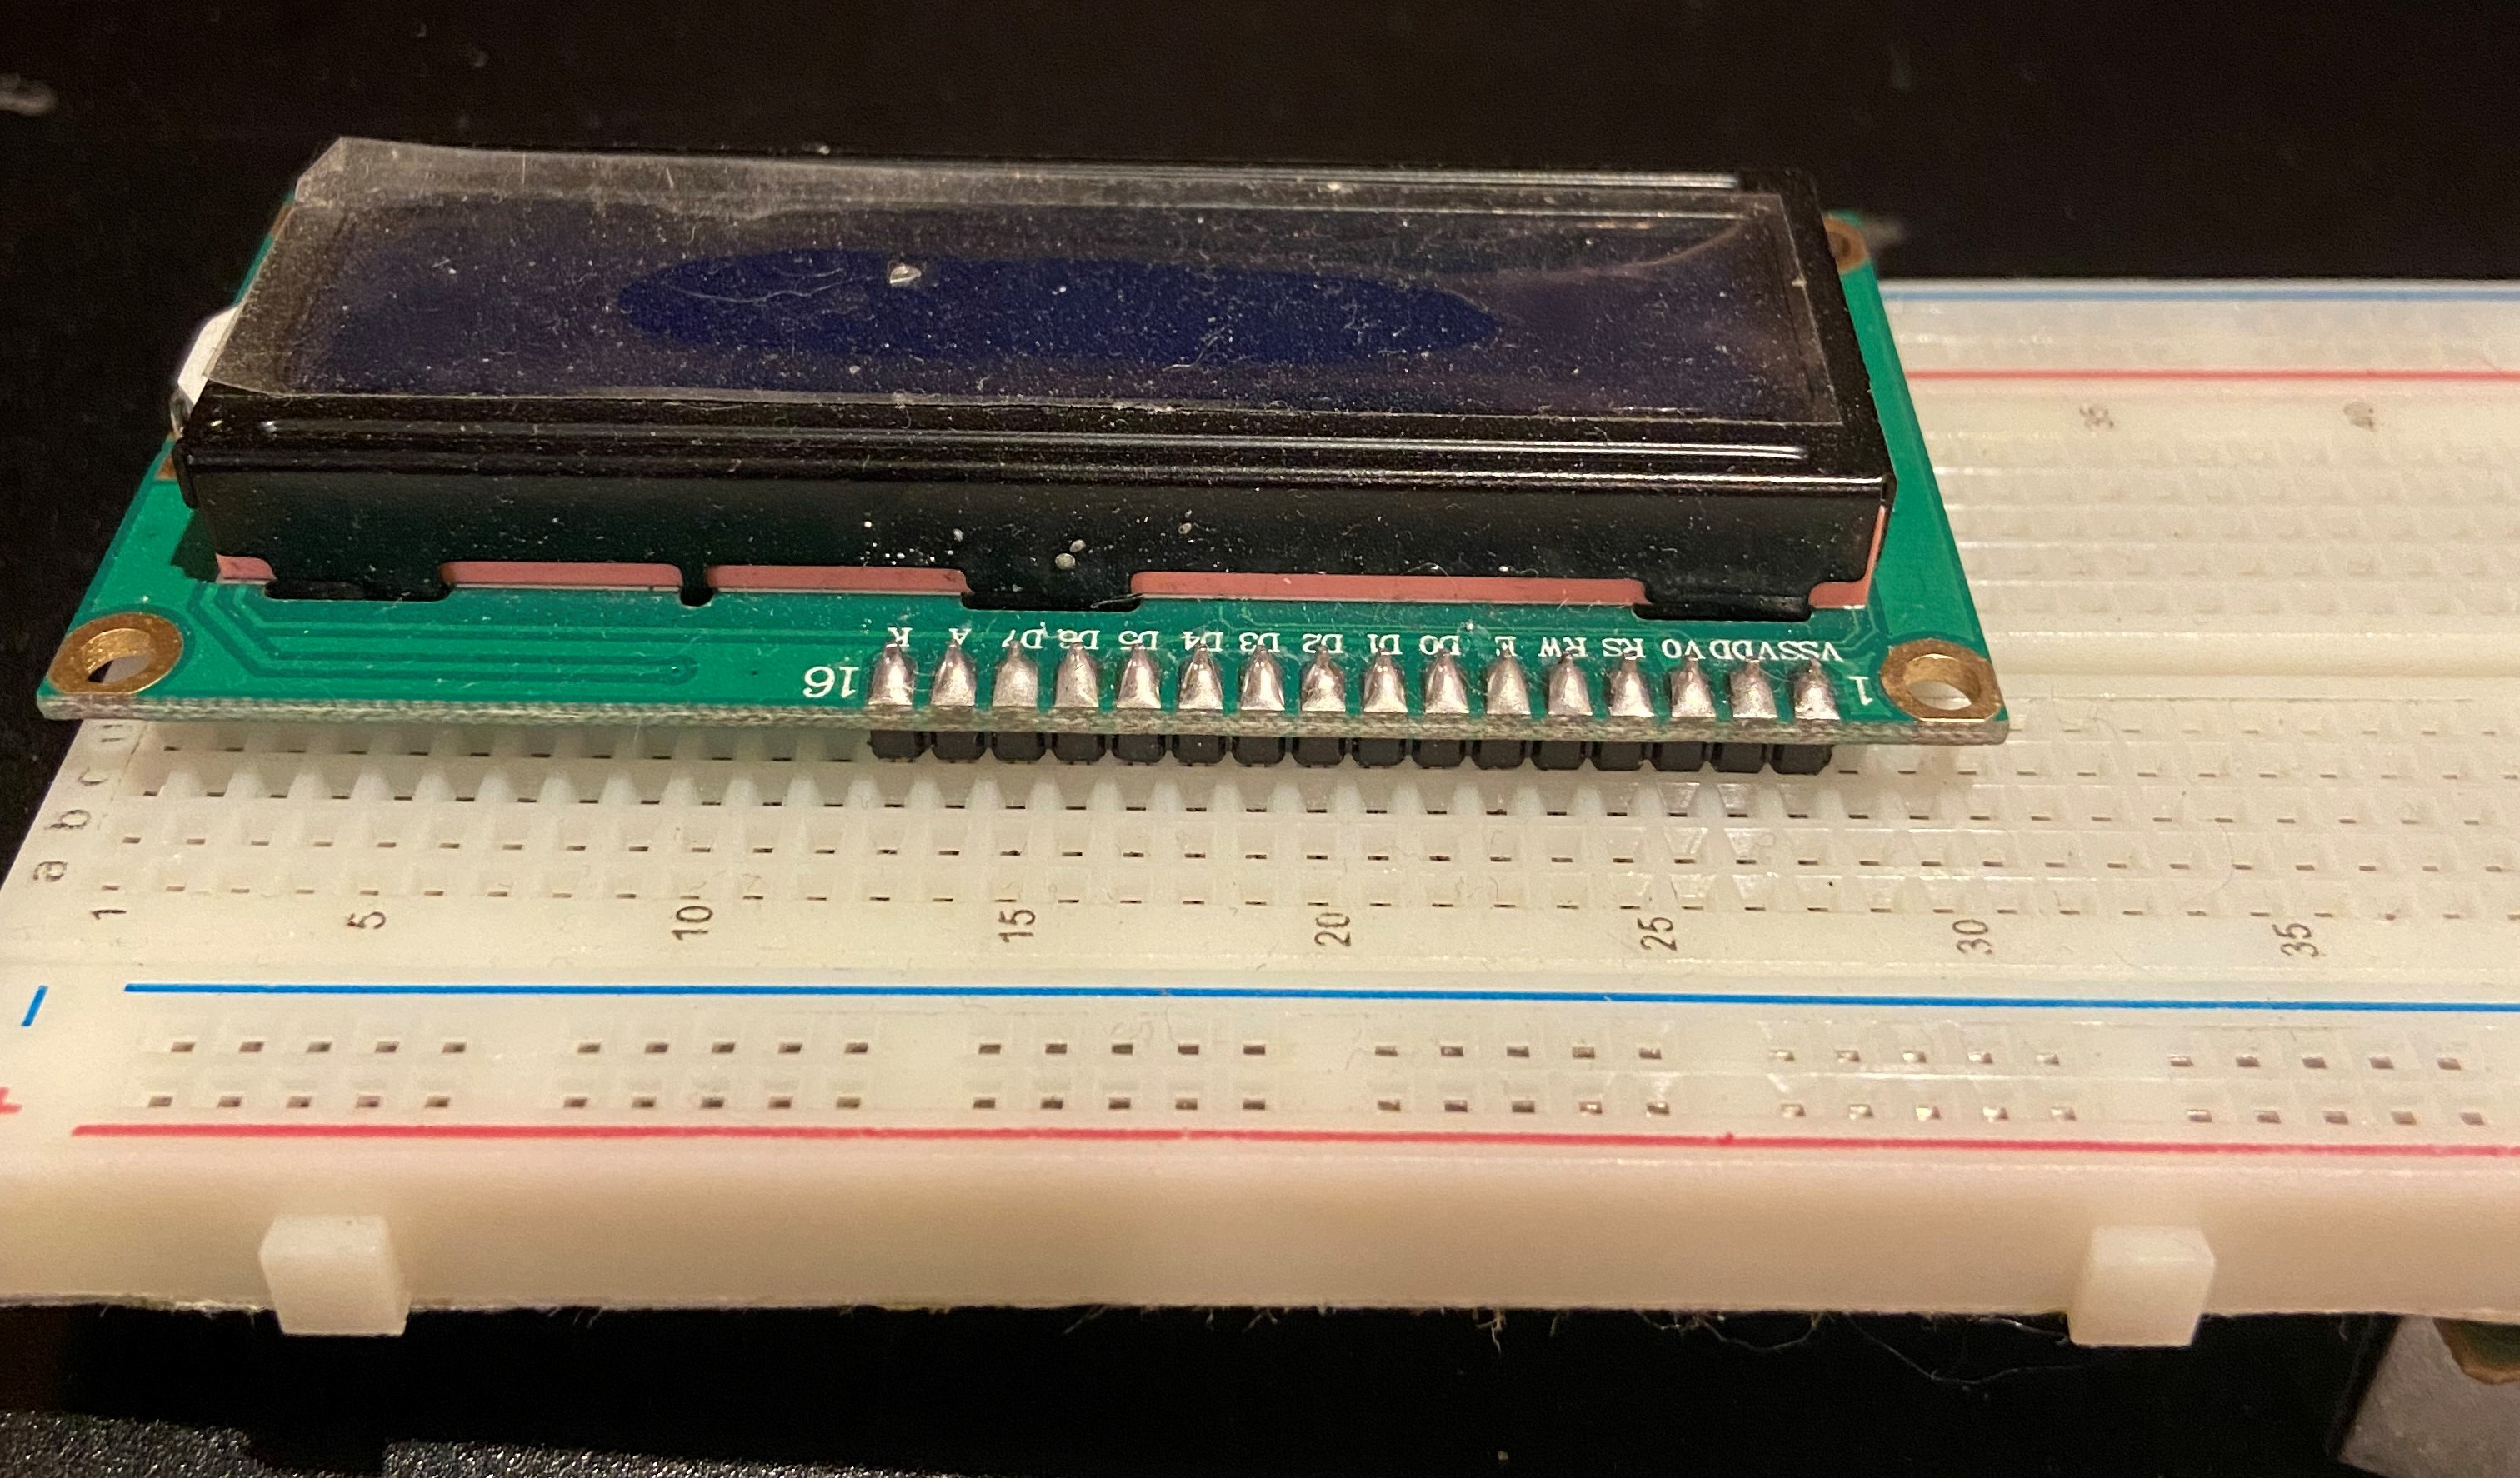
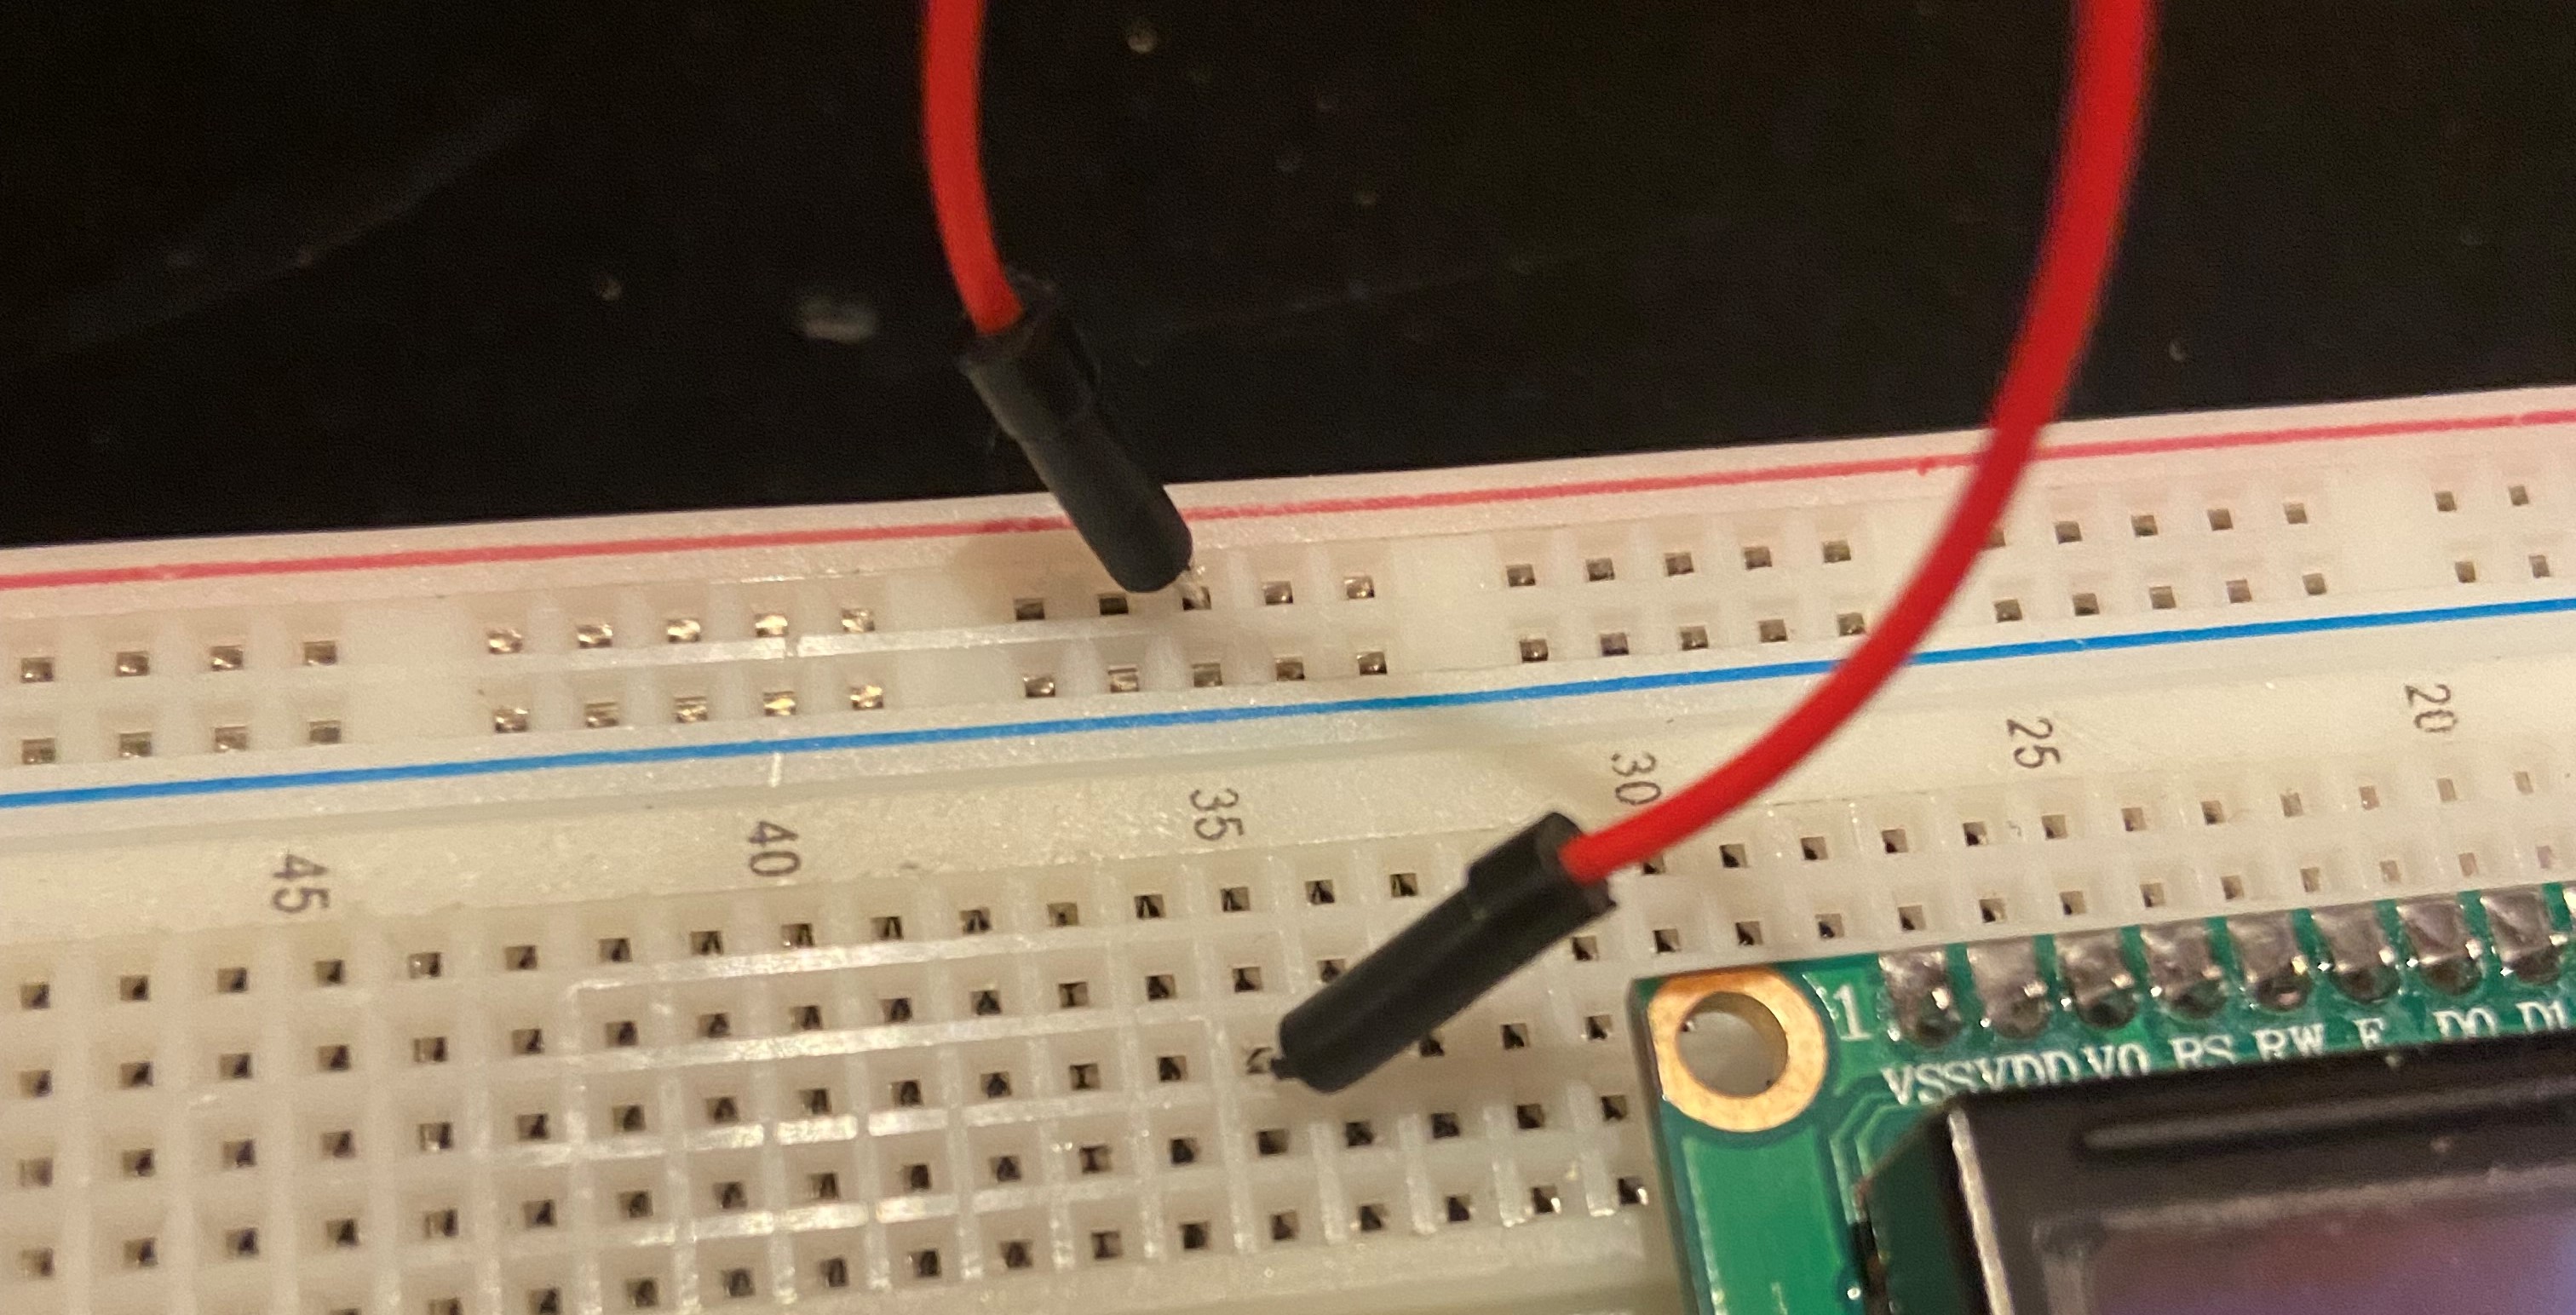
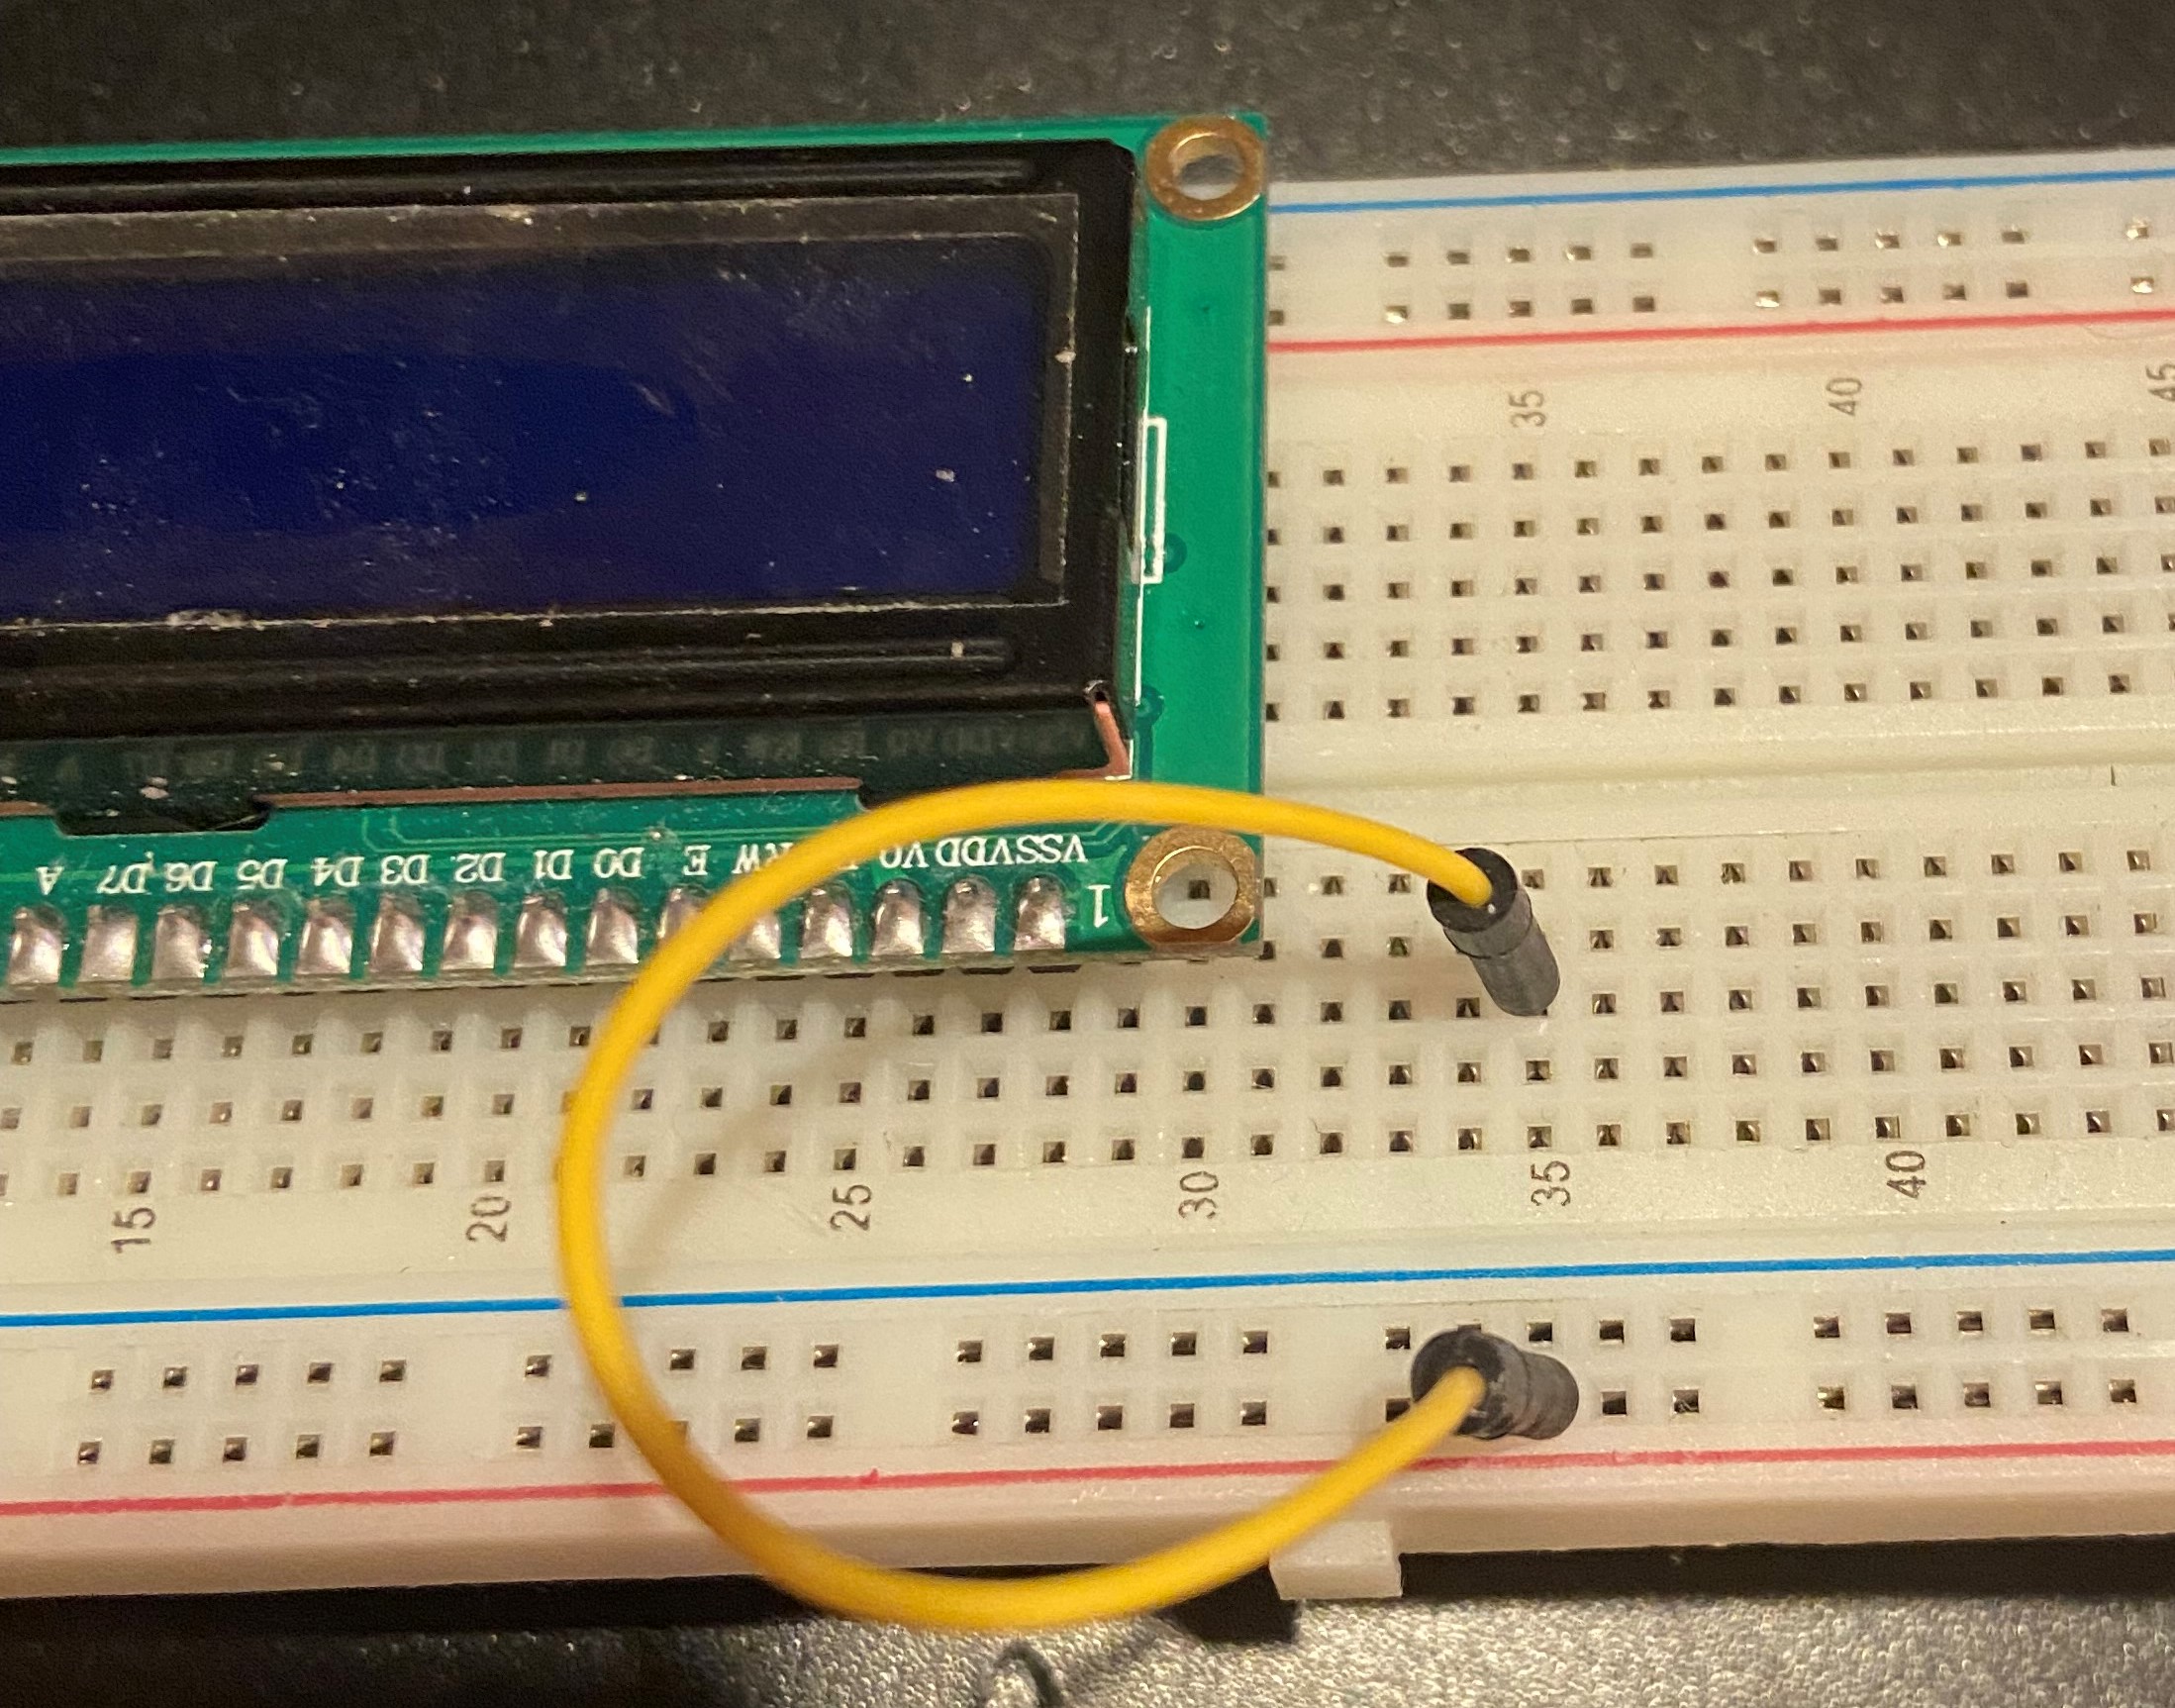
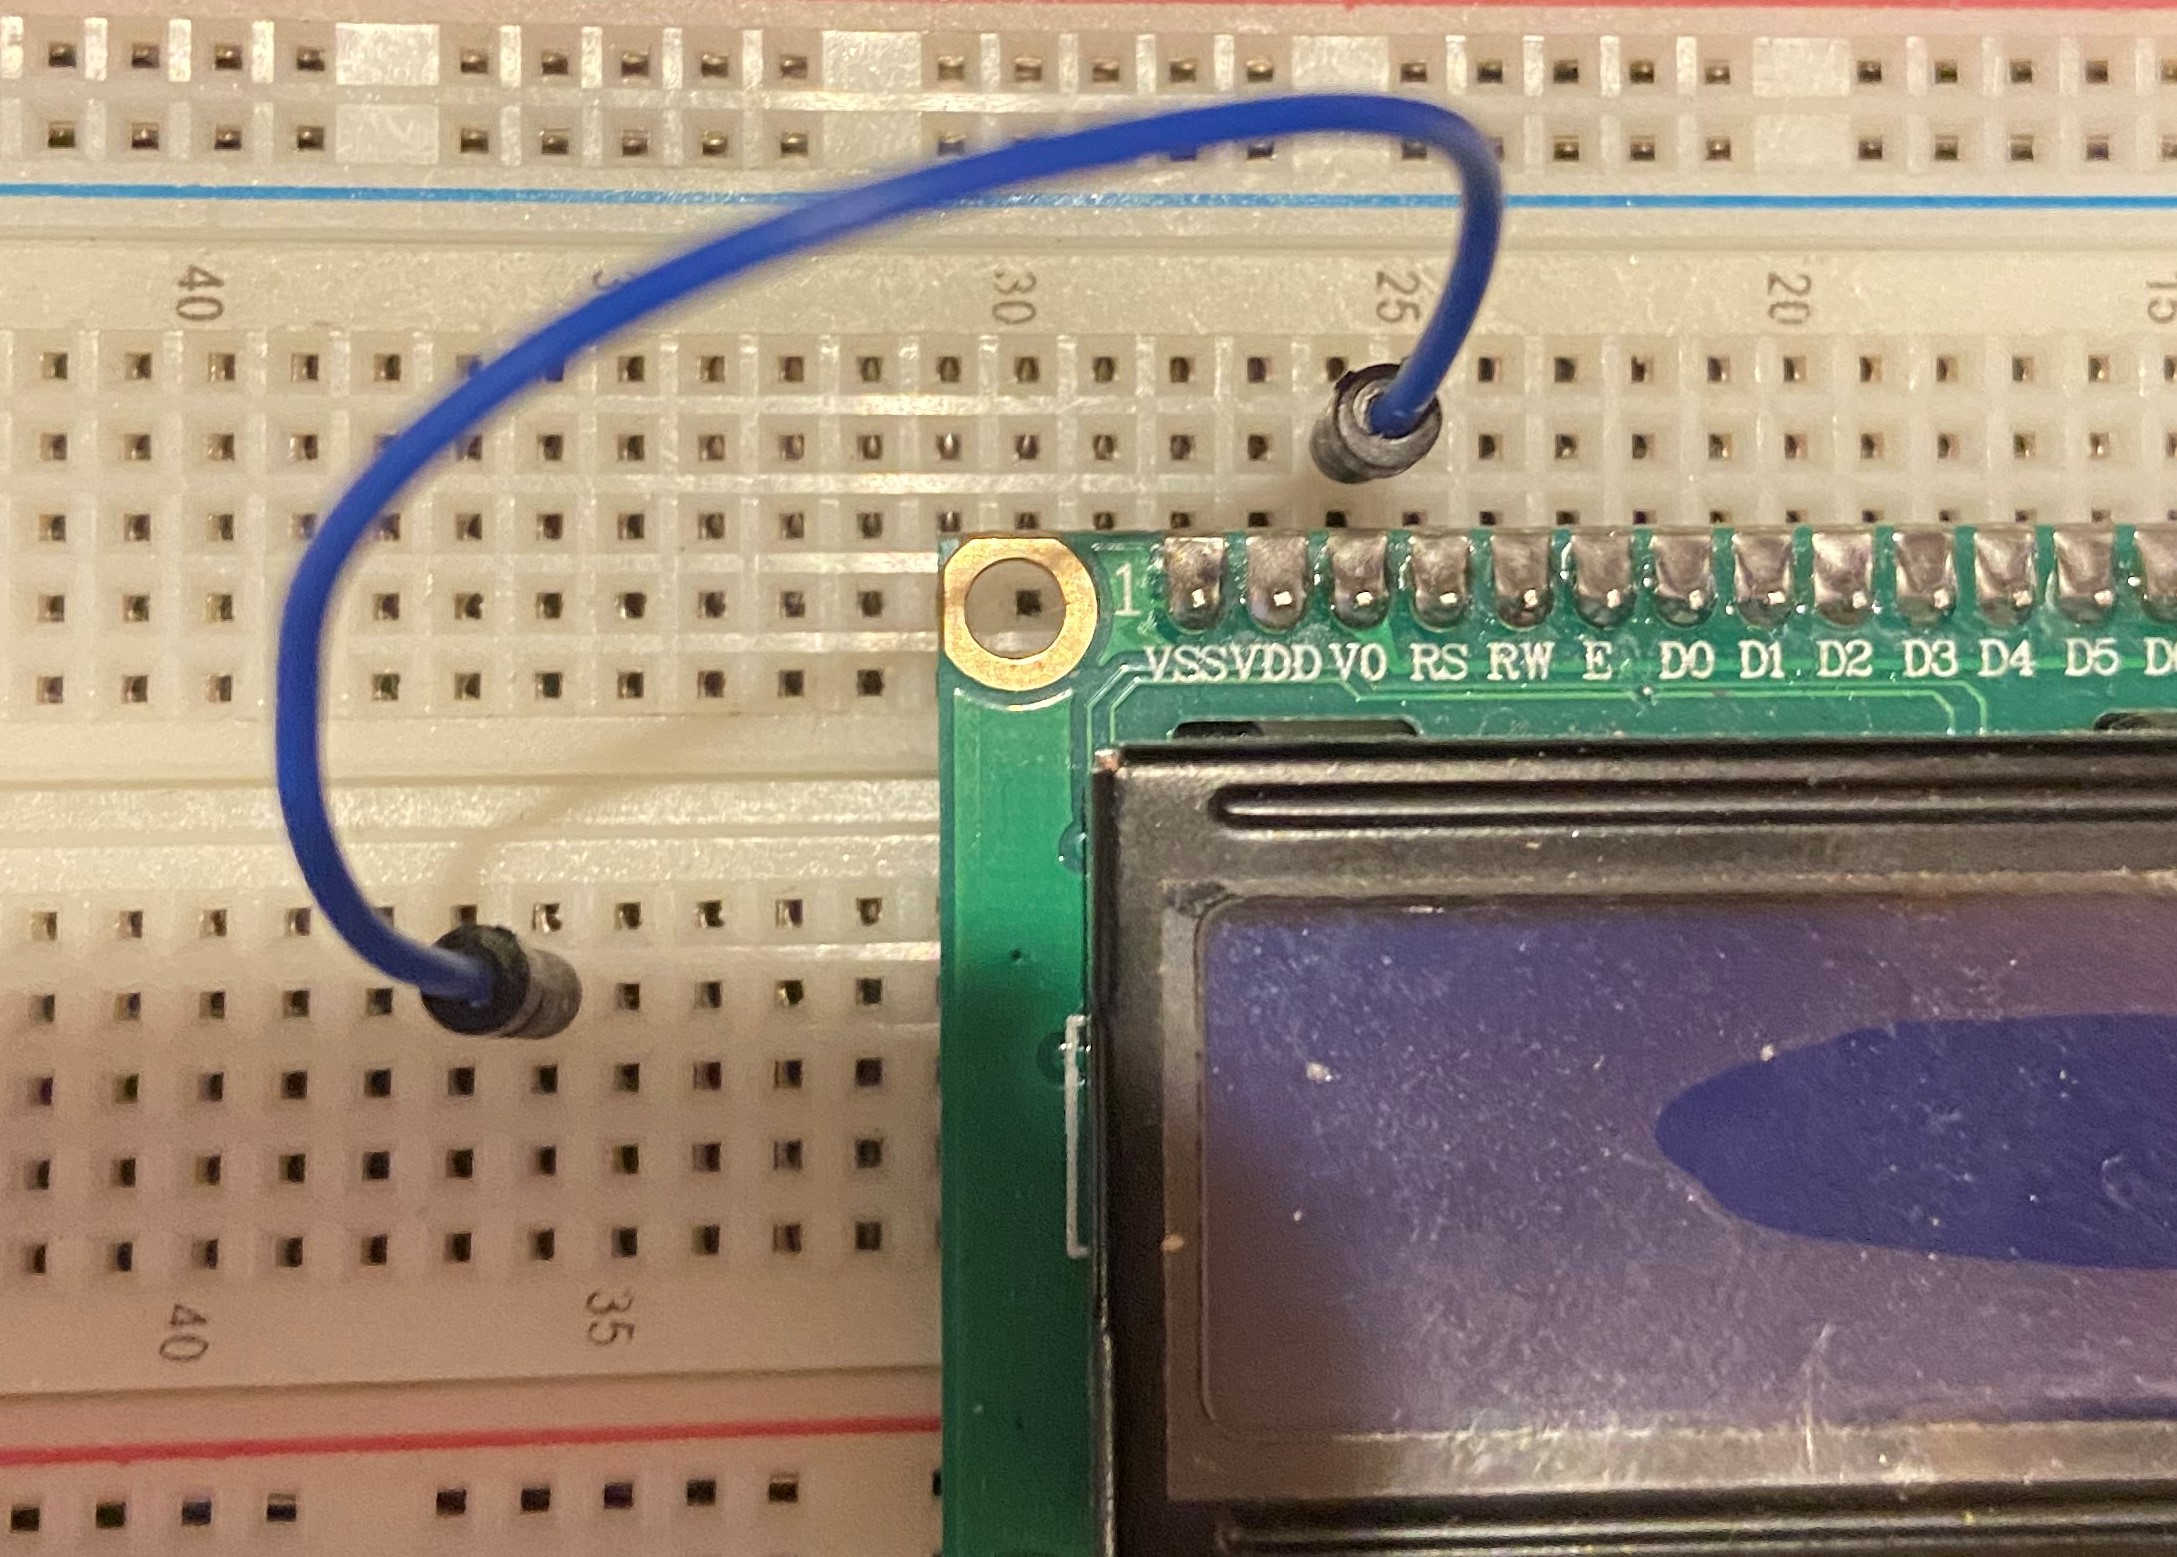
Next, start by connecting the LCD display. Plug the LCD display into D28 and line up the rest of the metal barbs with the neighboring slots on the breadboard. The Arduino, sensor, and battery will not plug snugly into the breadboard as the LCD display does, we used rubber bands to keep these components in place. Next we will connect the Arduino
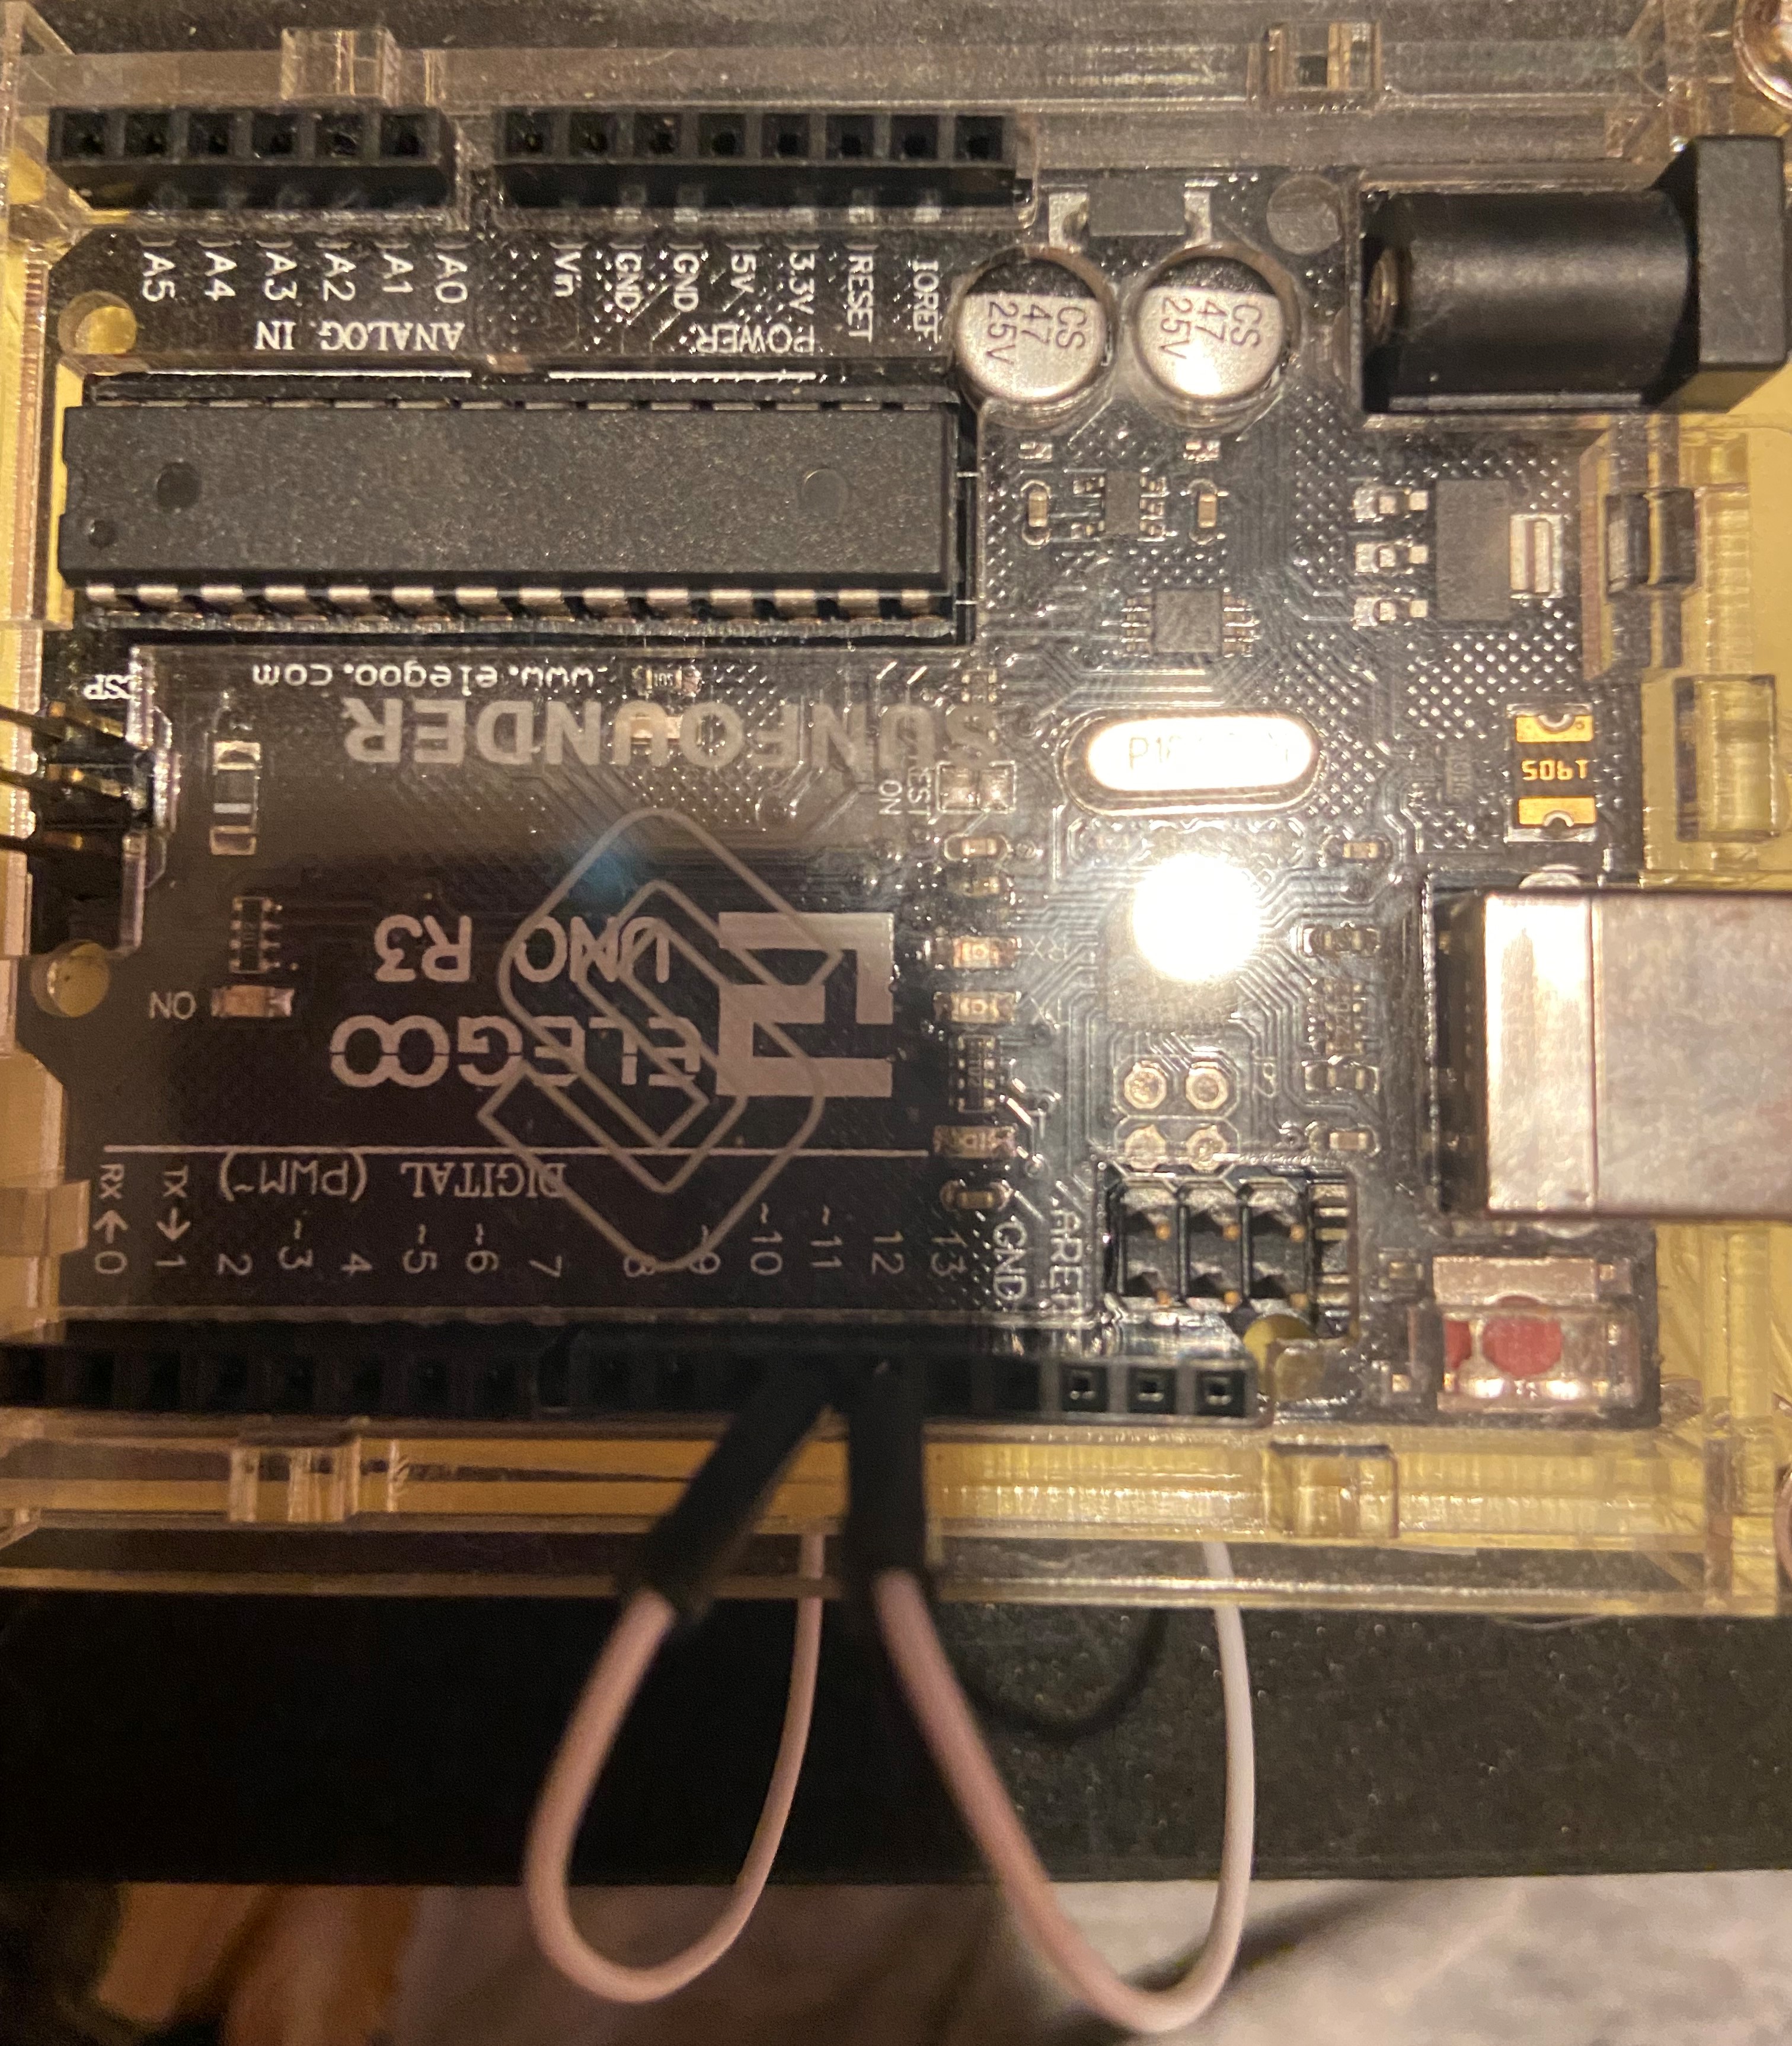
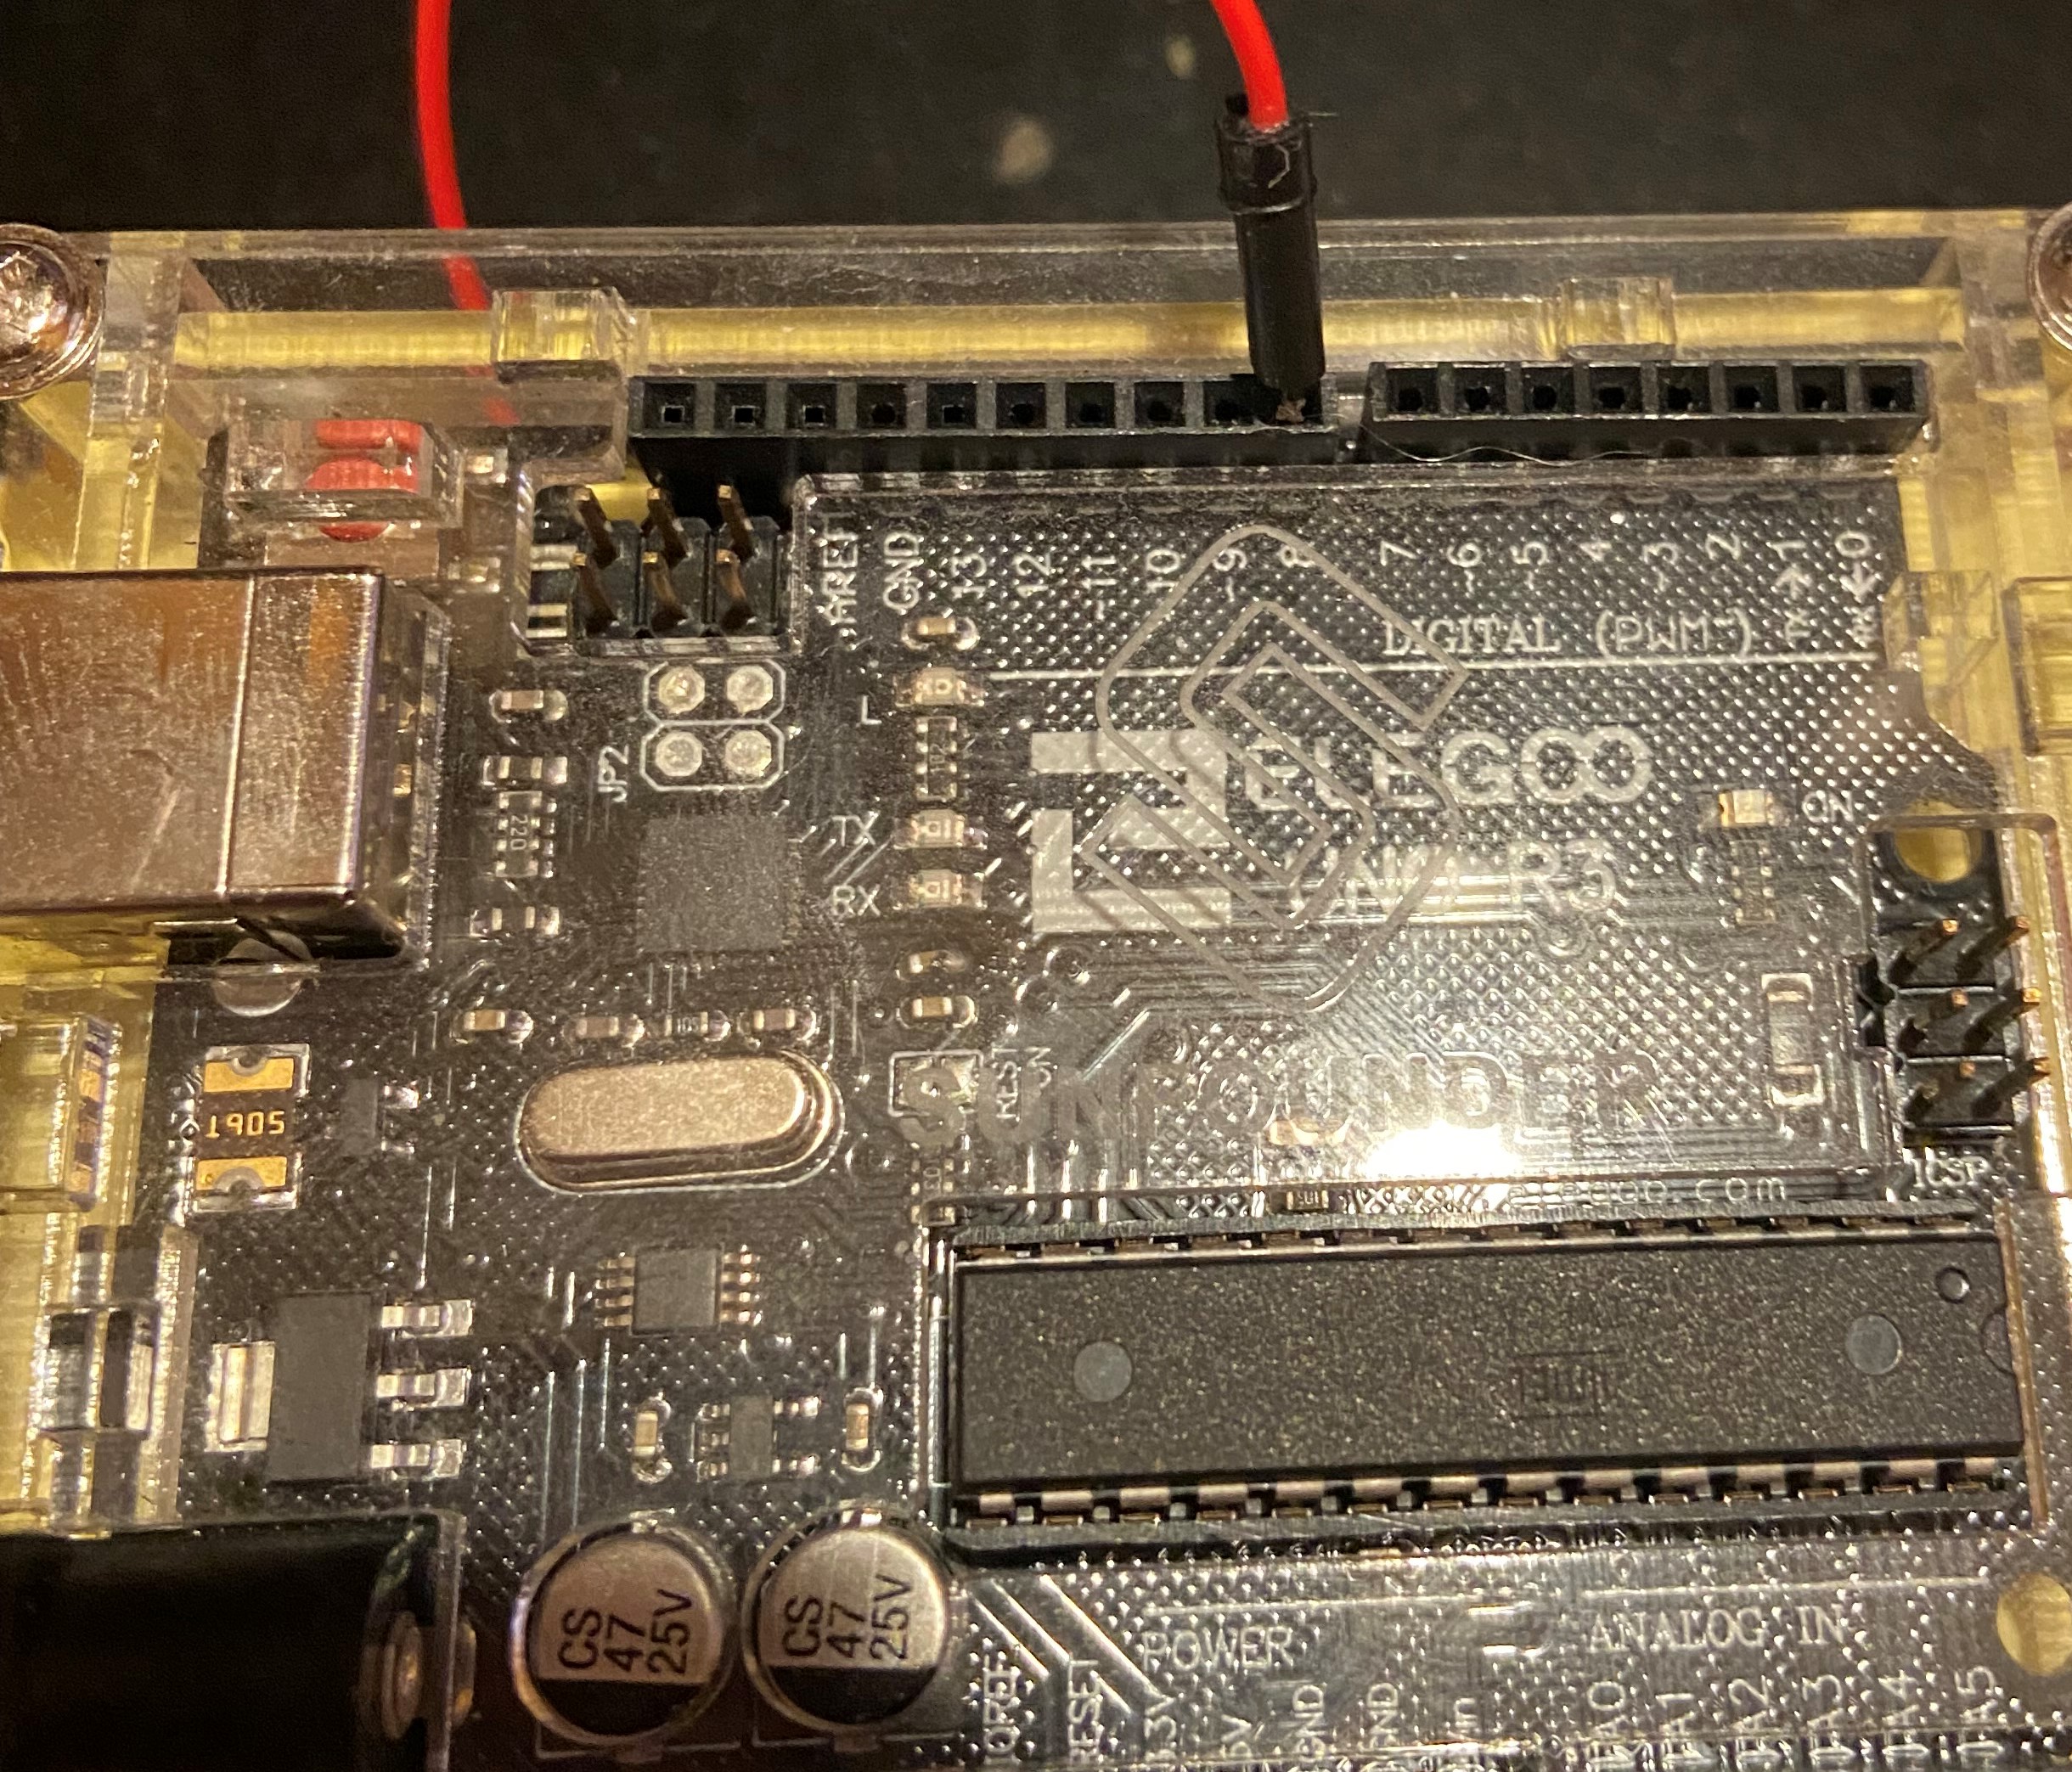
The Arduino connects to two distinct components, the laser particle sensor and the breadboard itself...we will start by connecting to the breadboard. Moving from right to left along the Arduino, connect a blue wire to Arduino GND and plug the other end into slot 10 minus (for the purpose of the rest of the document I will use "-" and "+" to in place of positive and negative terminals on the breadboard).
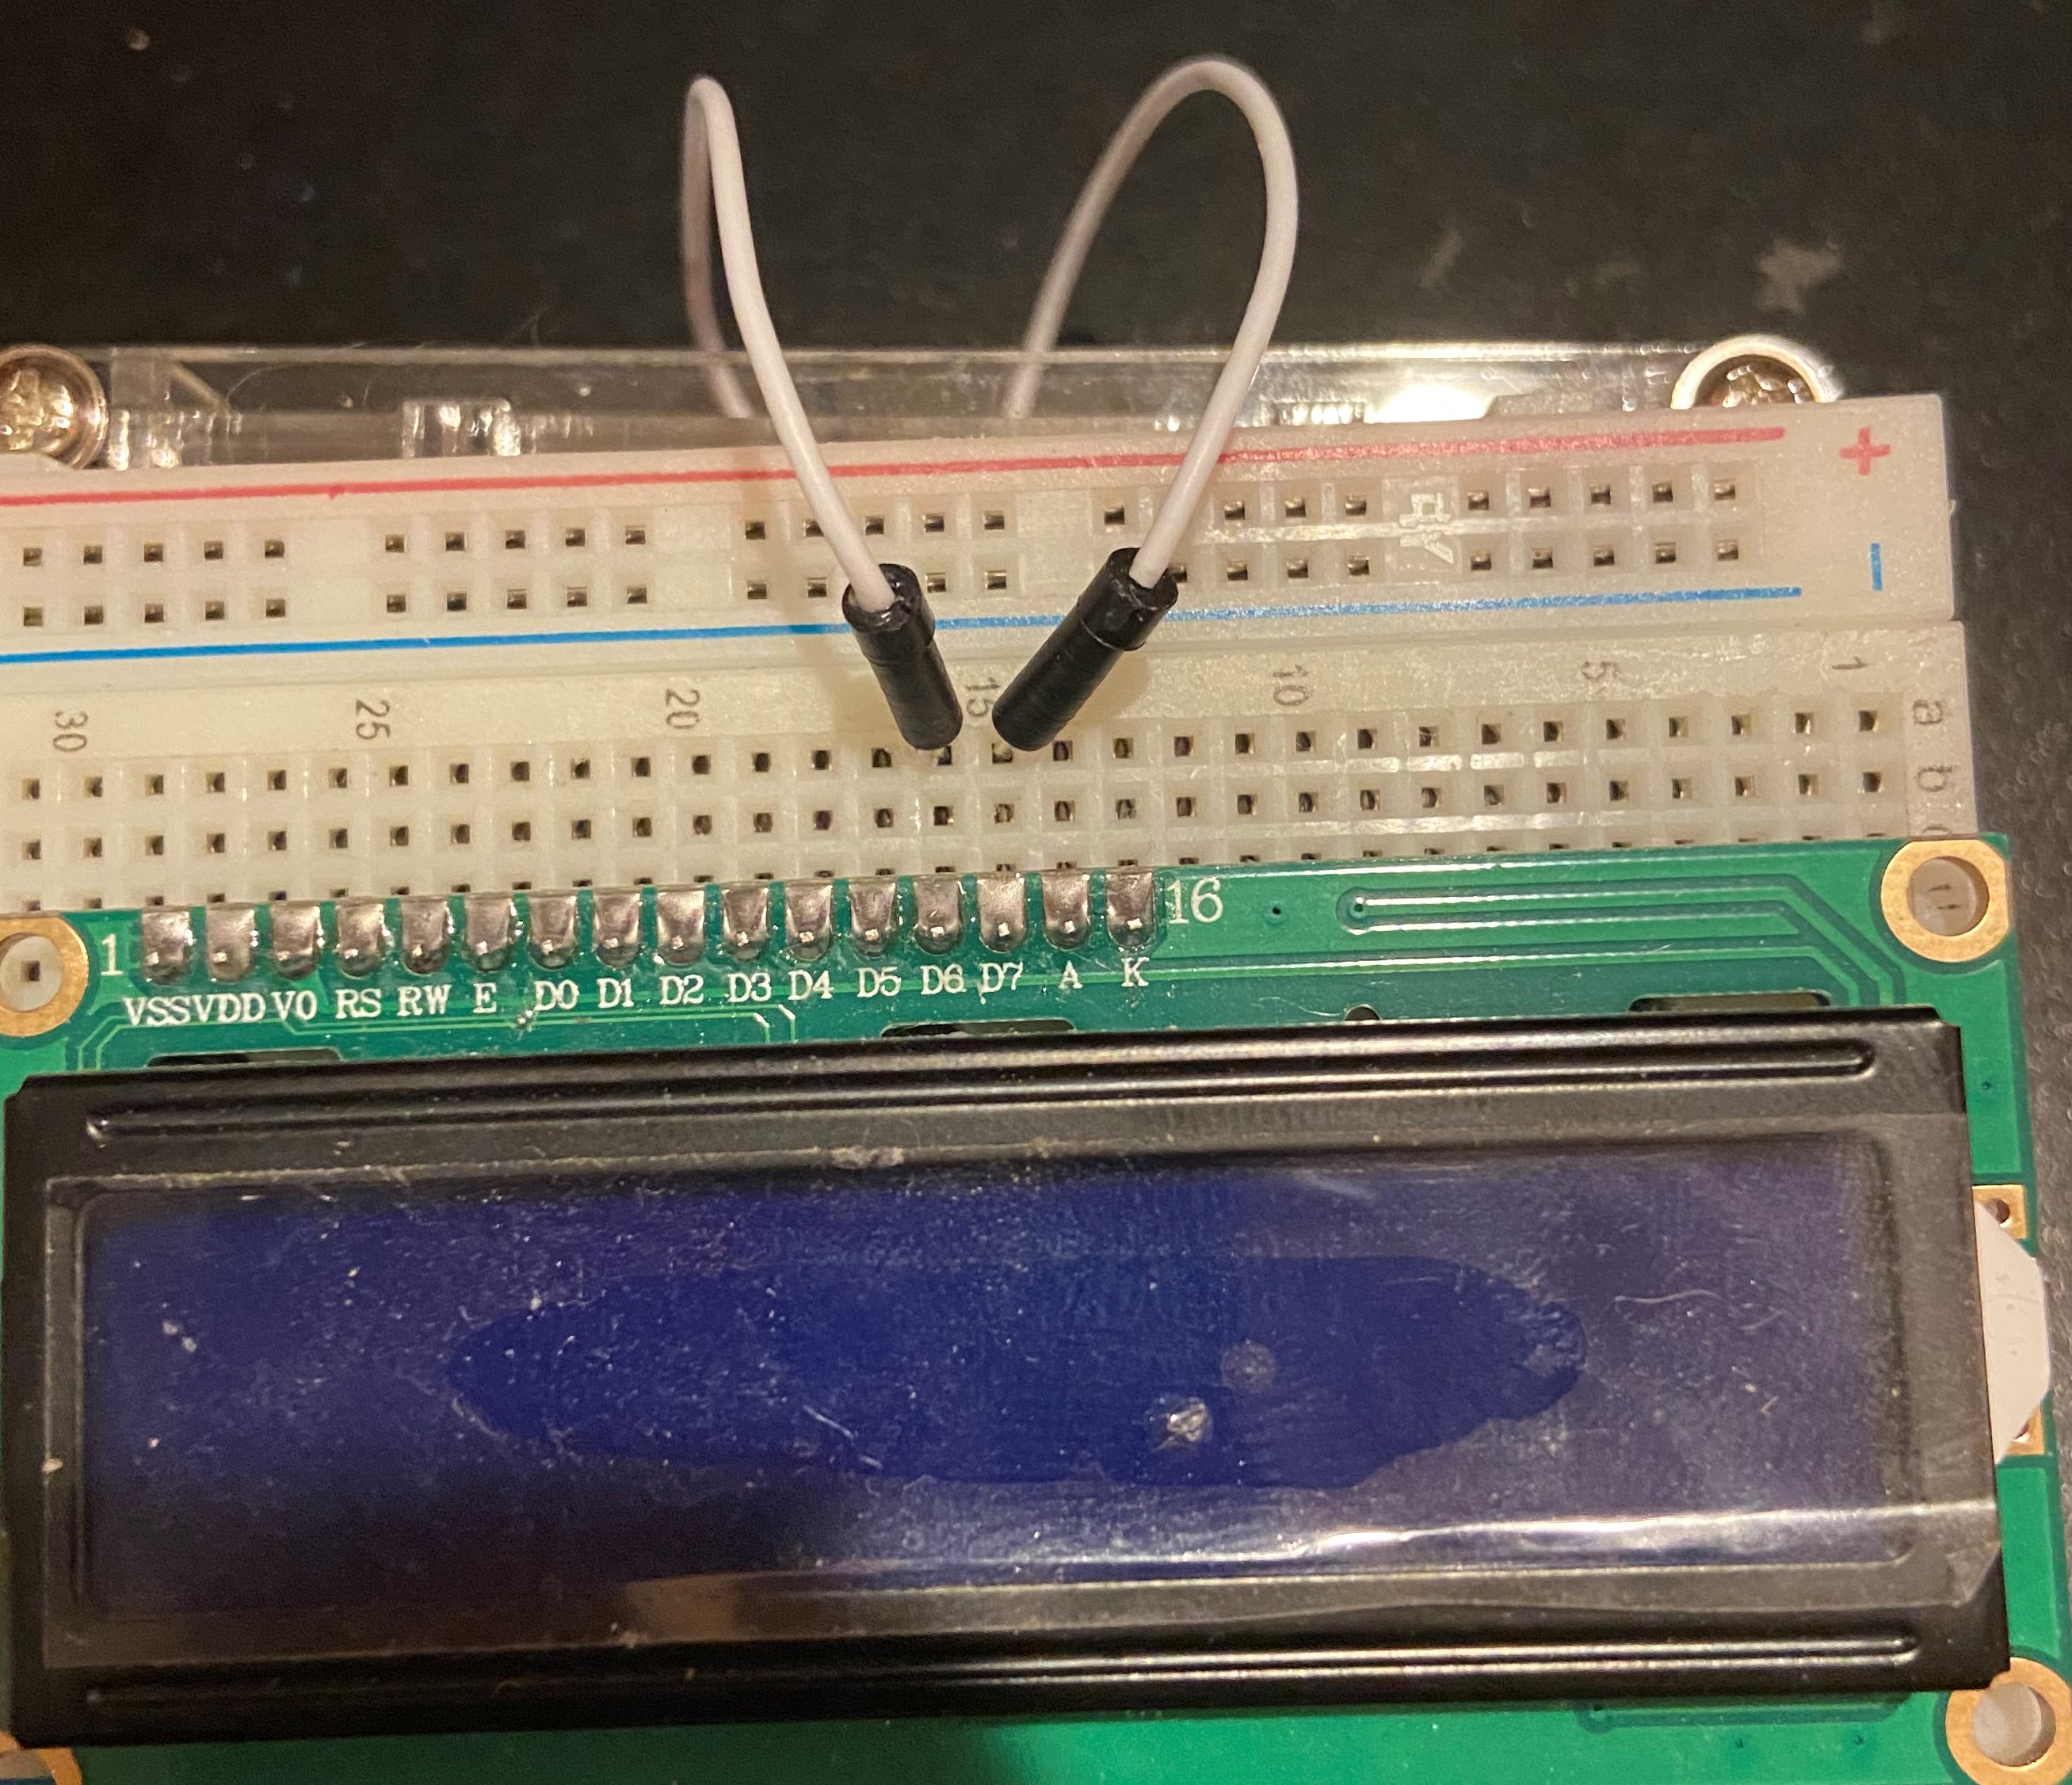
Next connect a white wire into Arduino slot 12 and connect the other end to 15a.
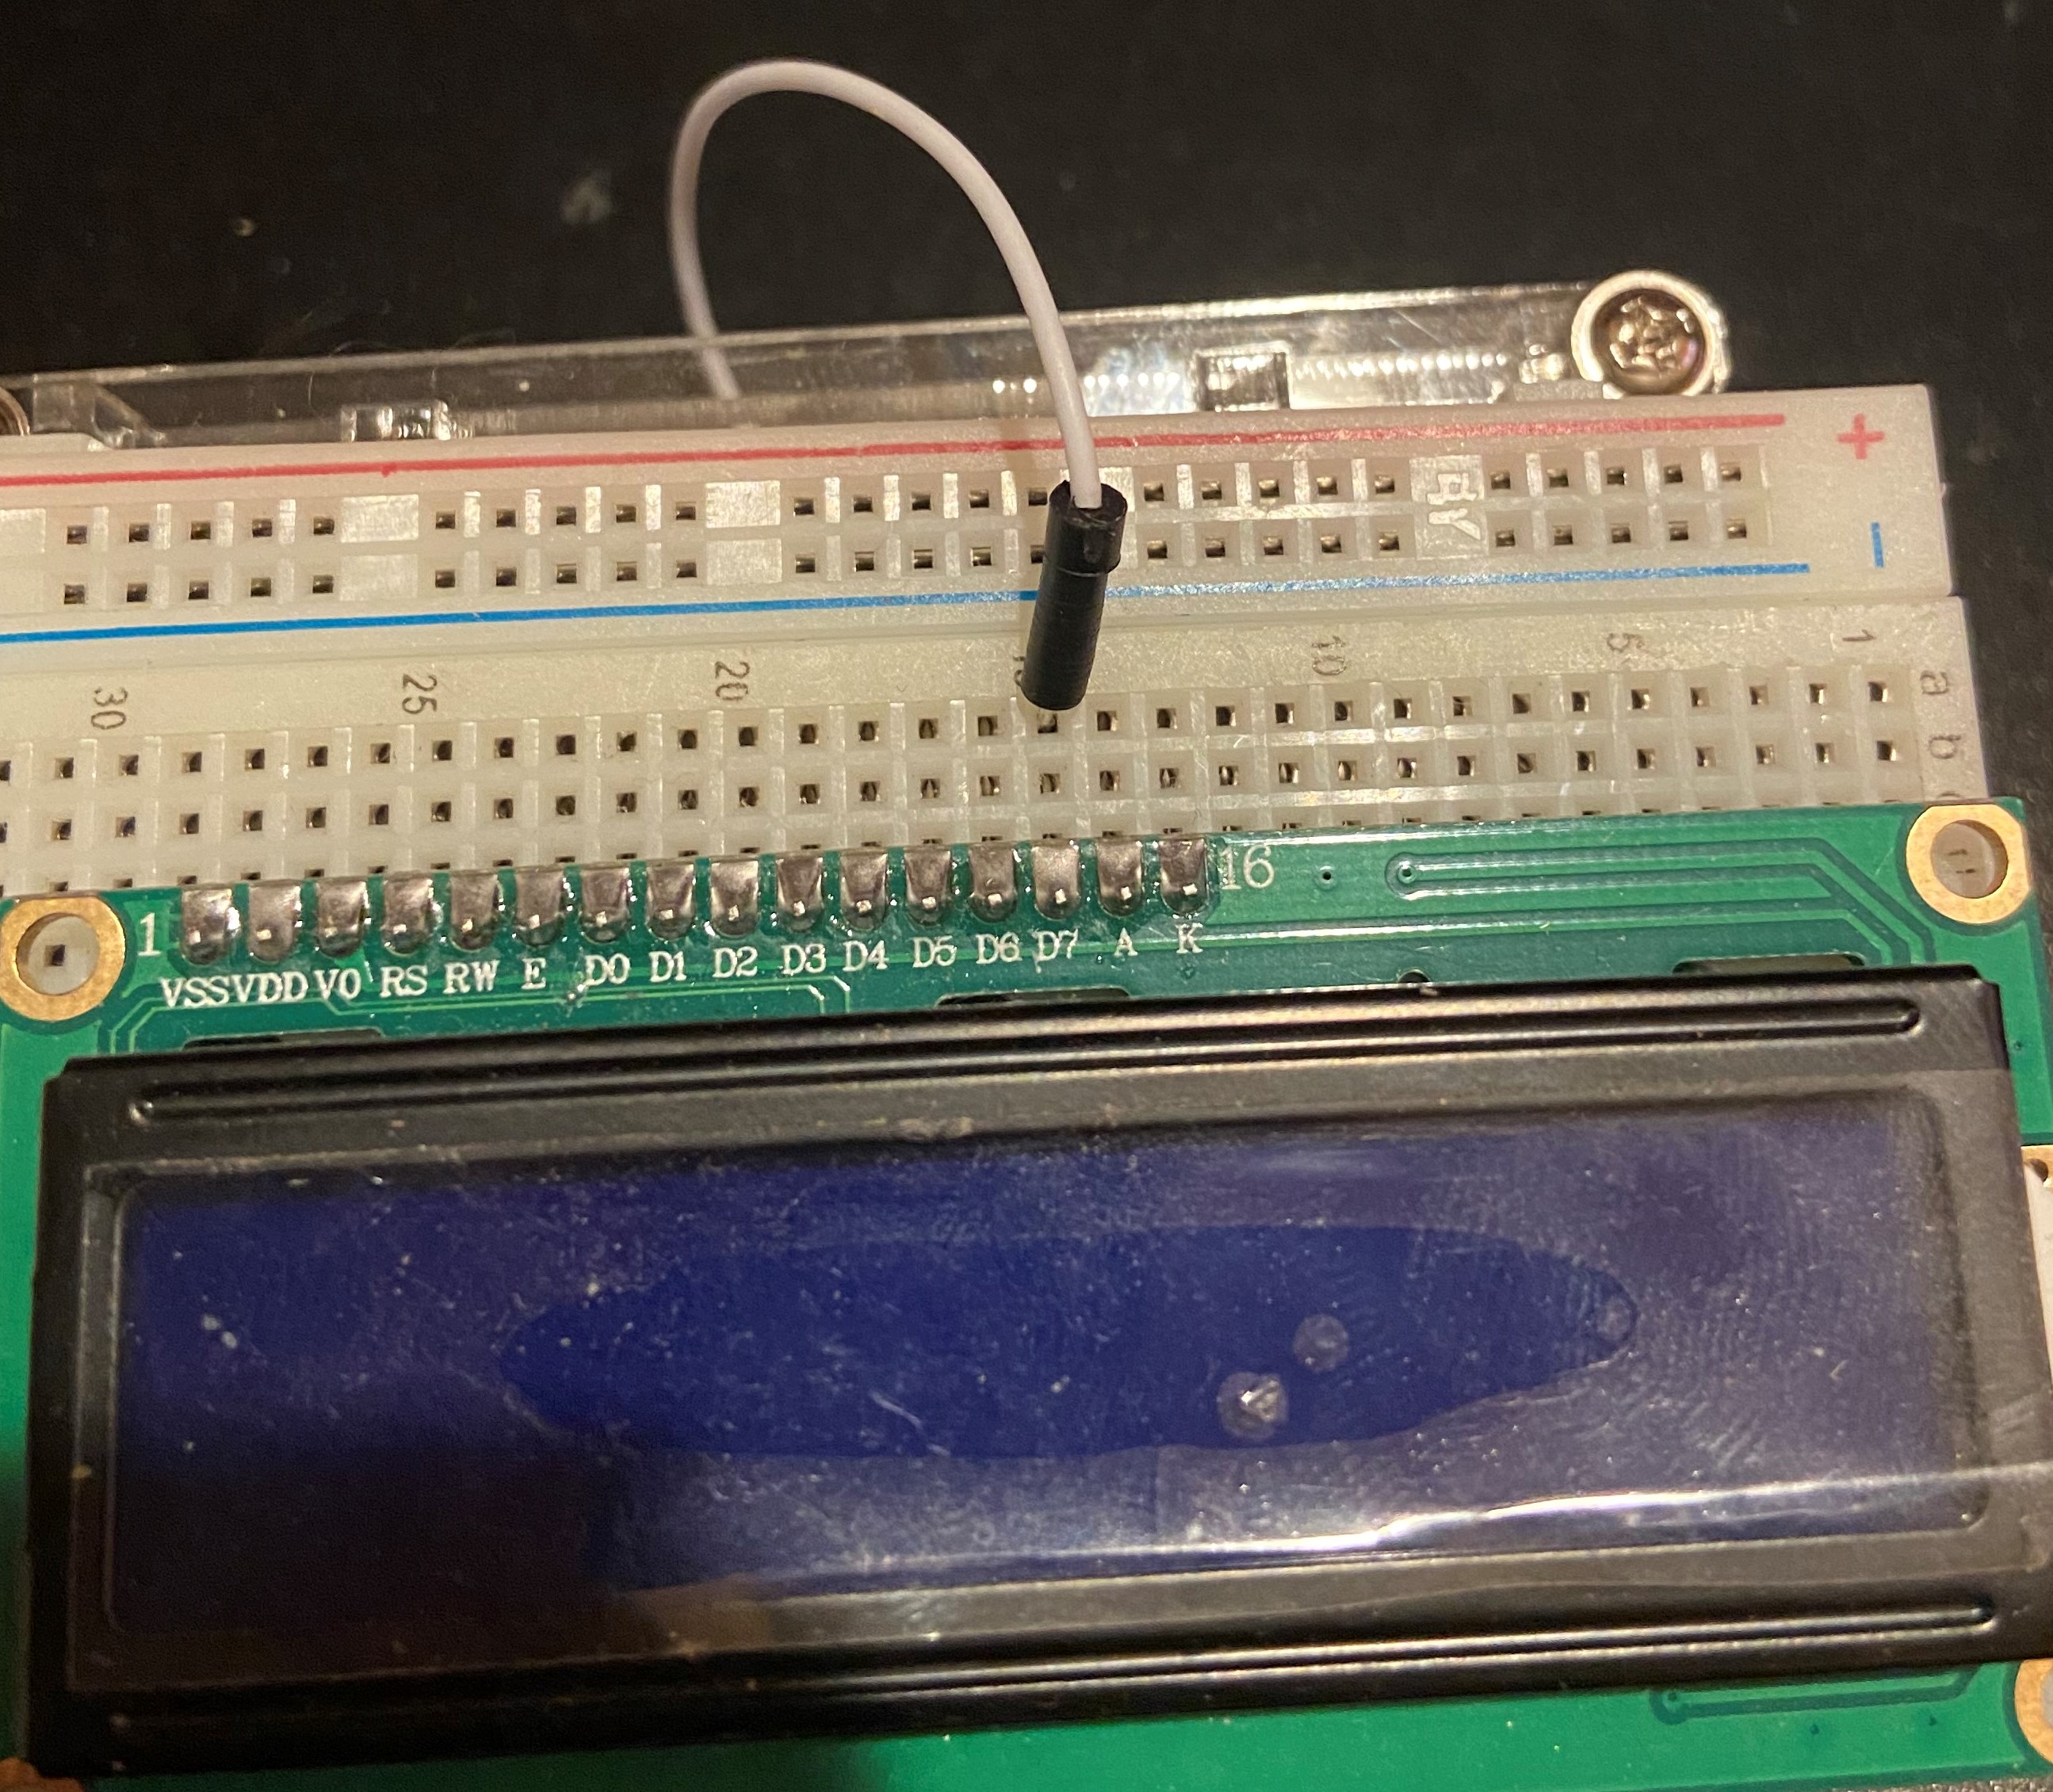
Next, connect another white wire to Arduino 11 with the other end connecting to 16a.
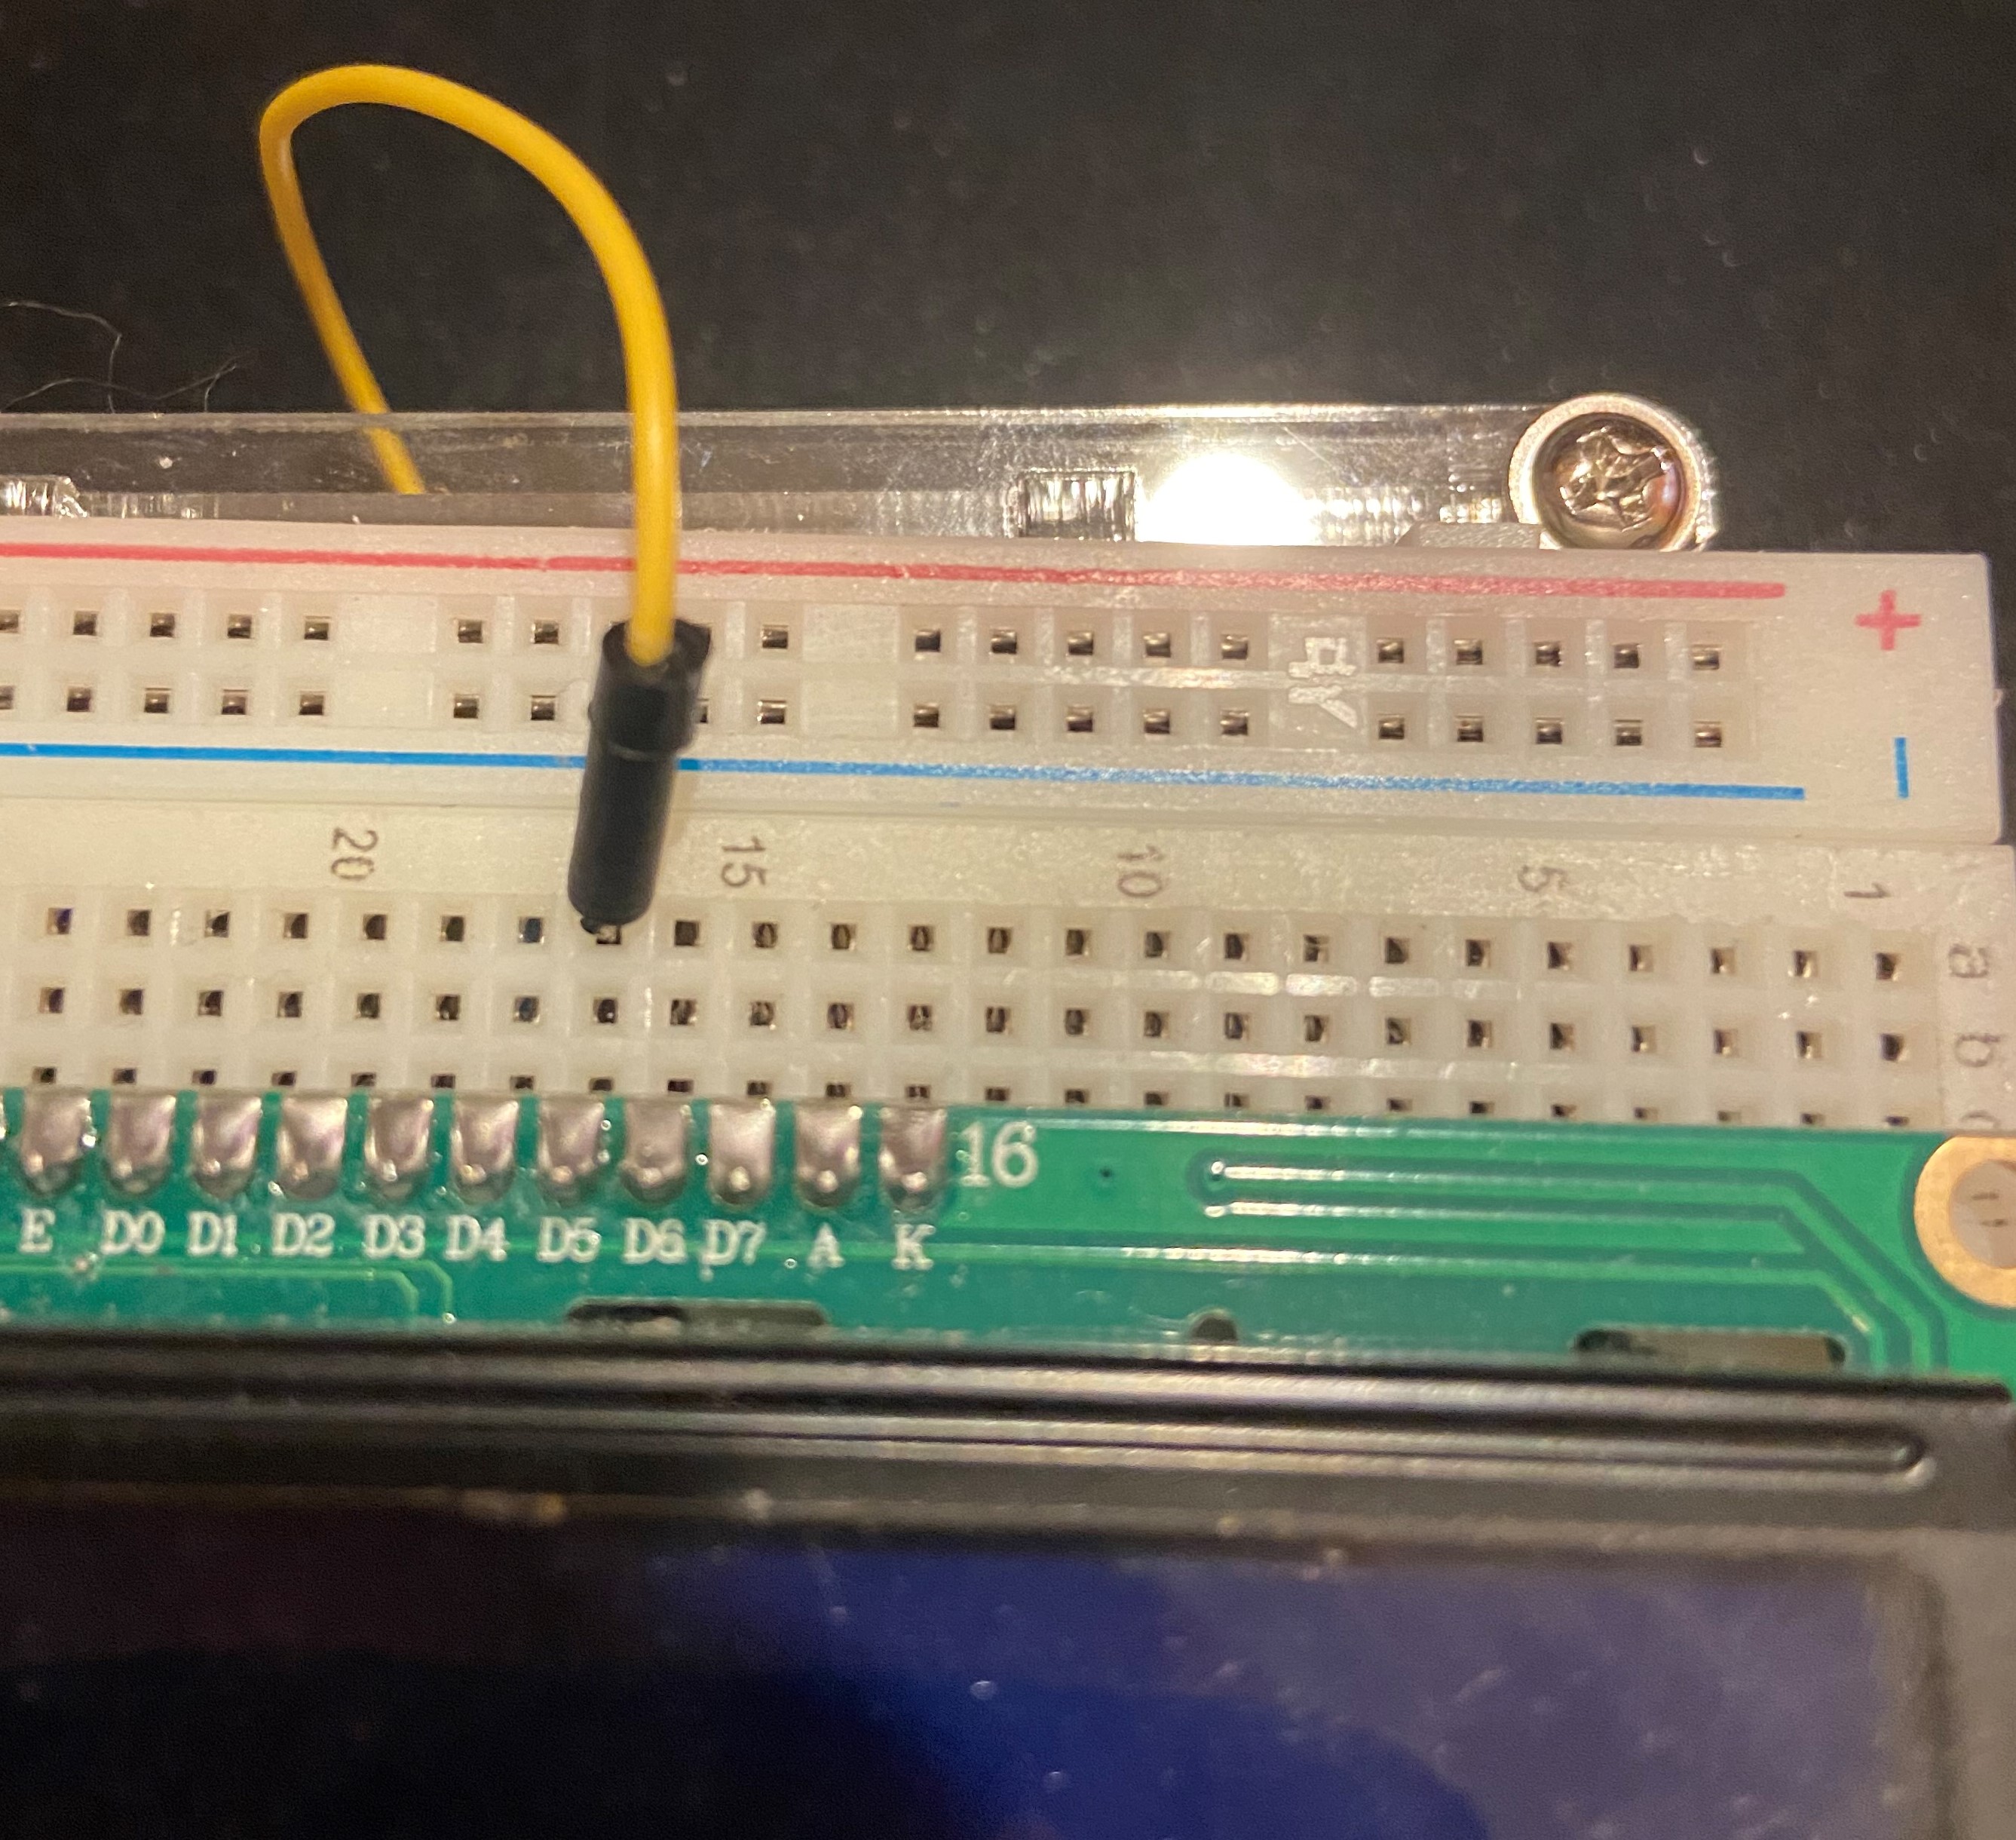
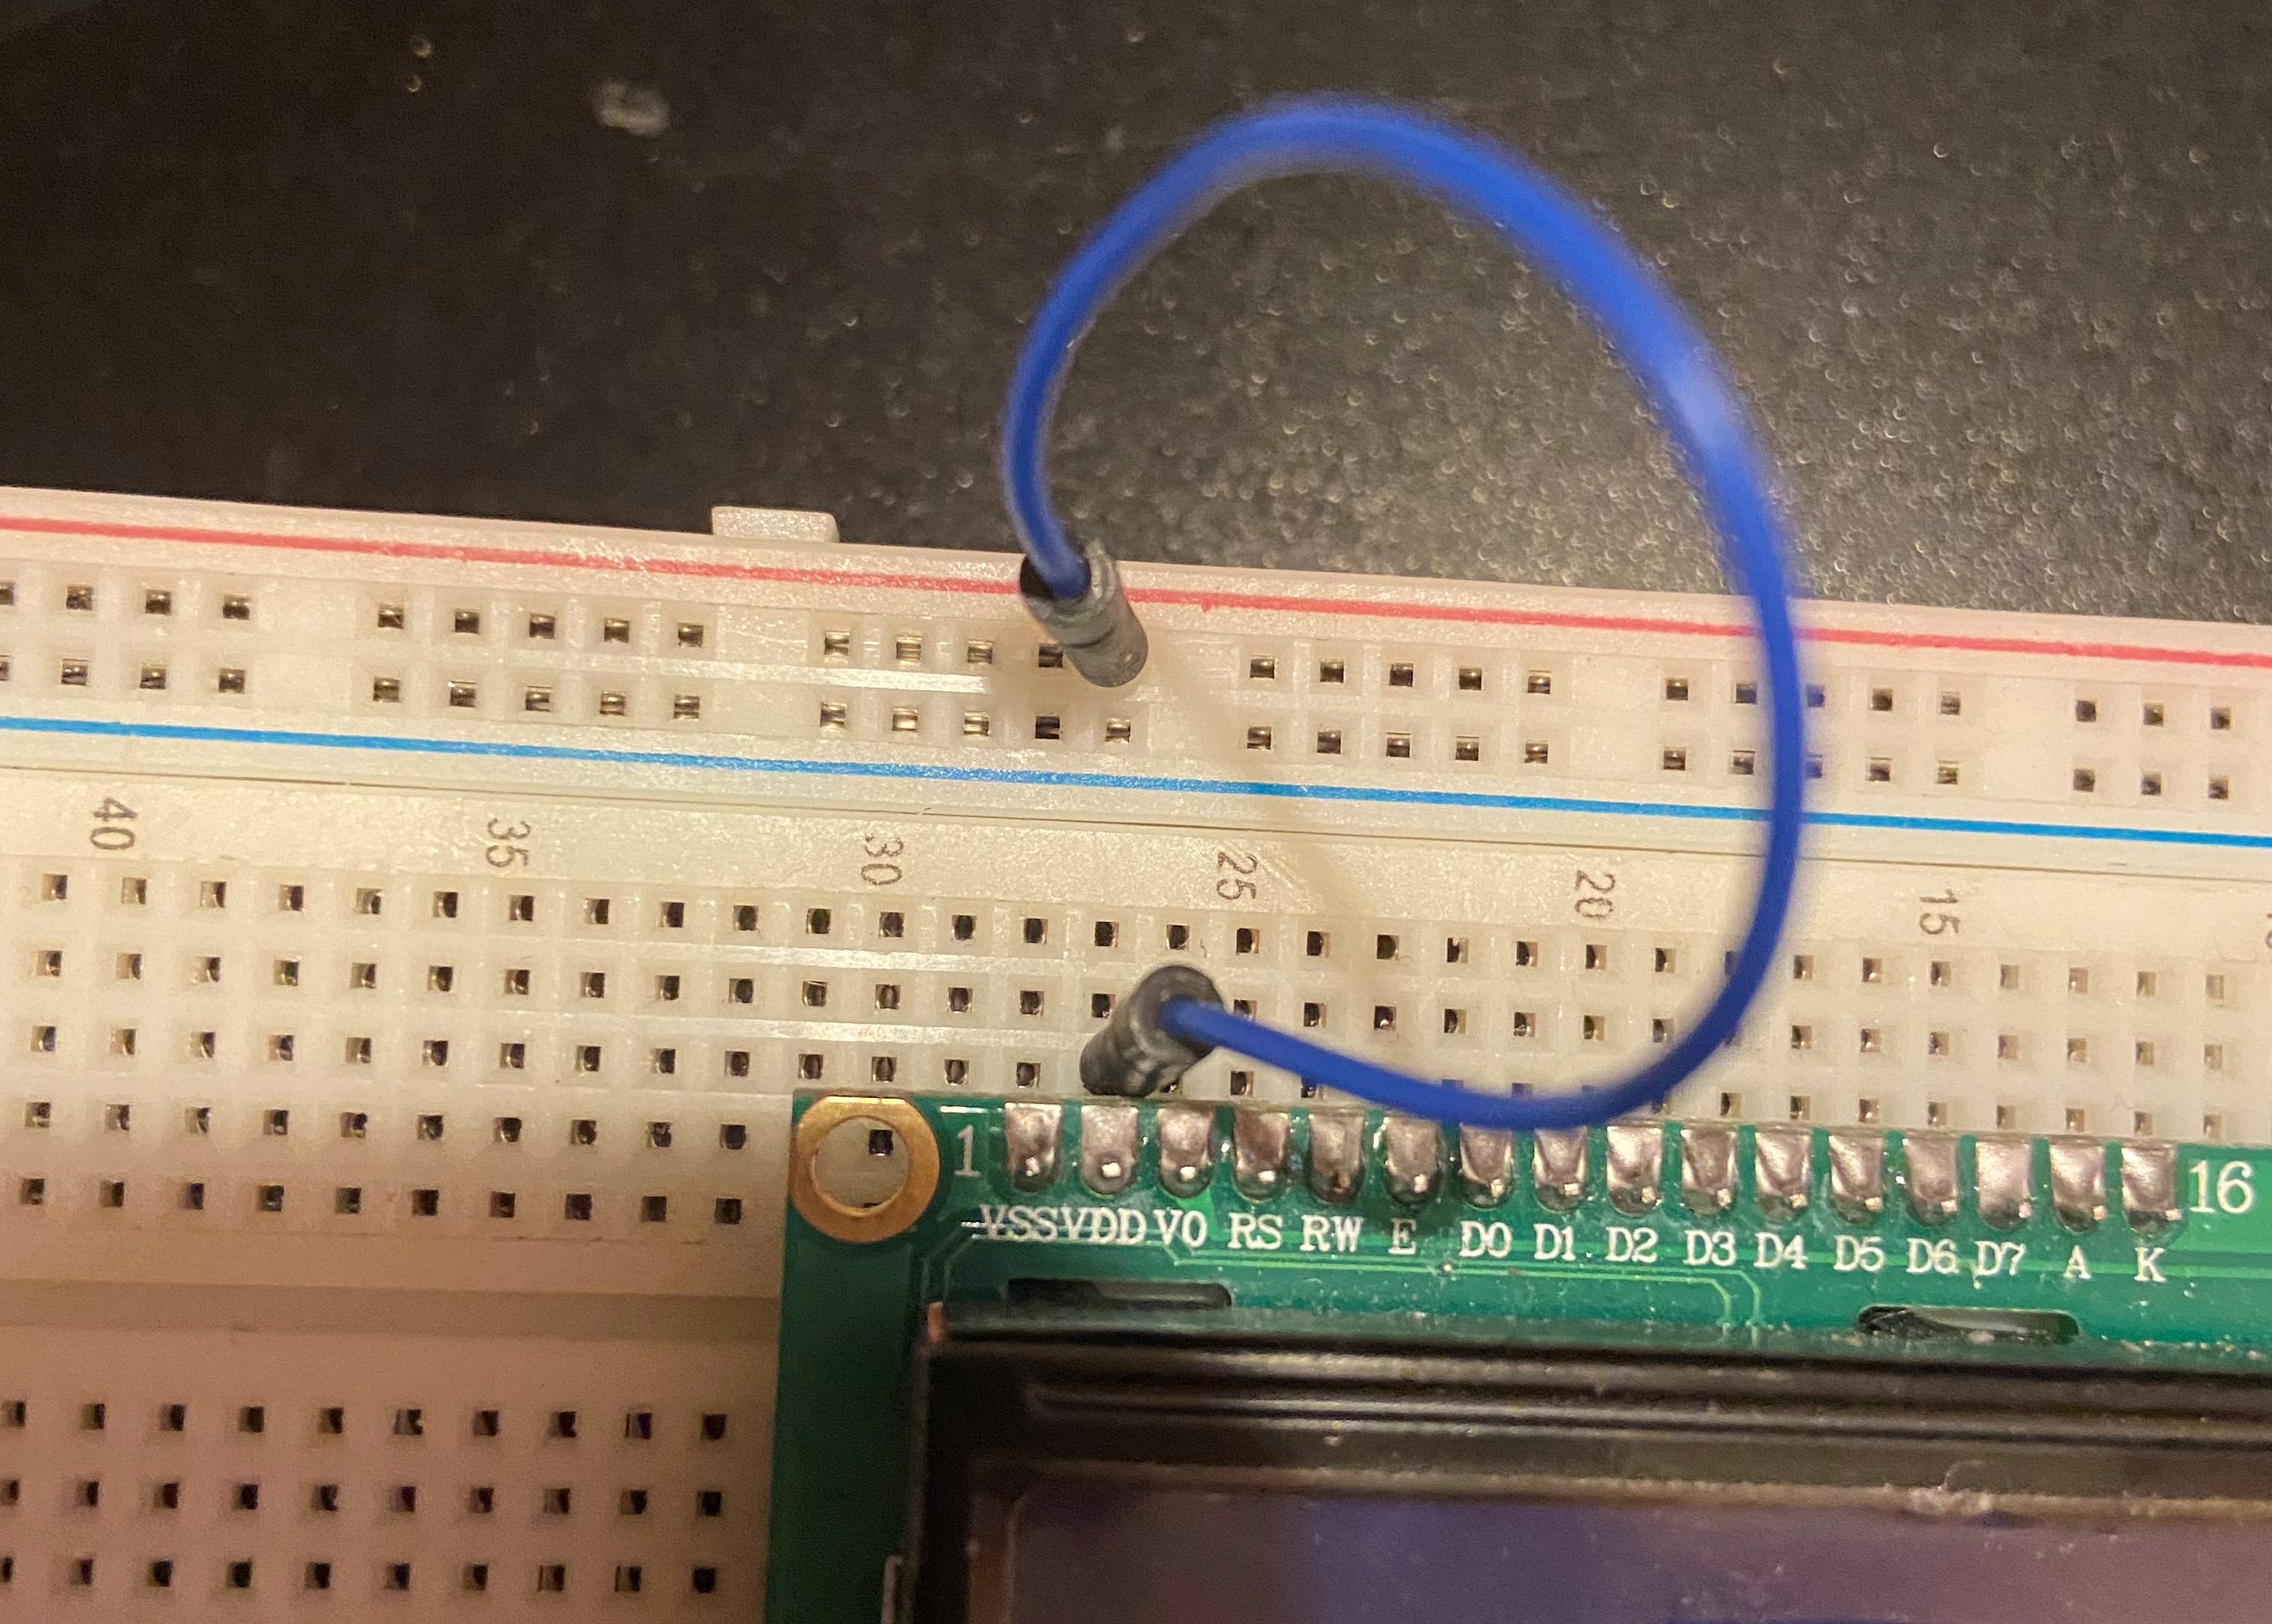
A yellow wire follows in Arduino 10, ending in 17a
A red wire follows this plugging into Arduino 9 and breadboard 18a.
-Next is another red wire plugging into Arduino 8, this wire connects to breadboard slot 23a.
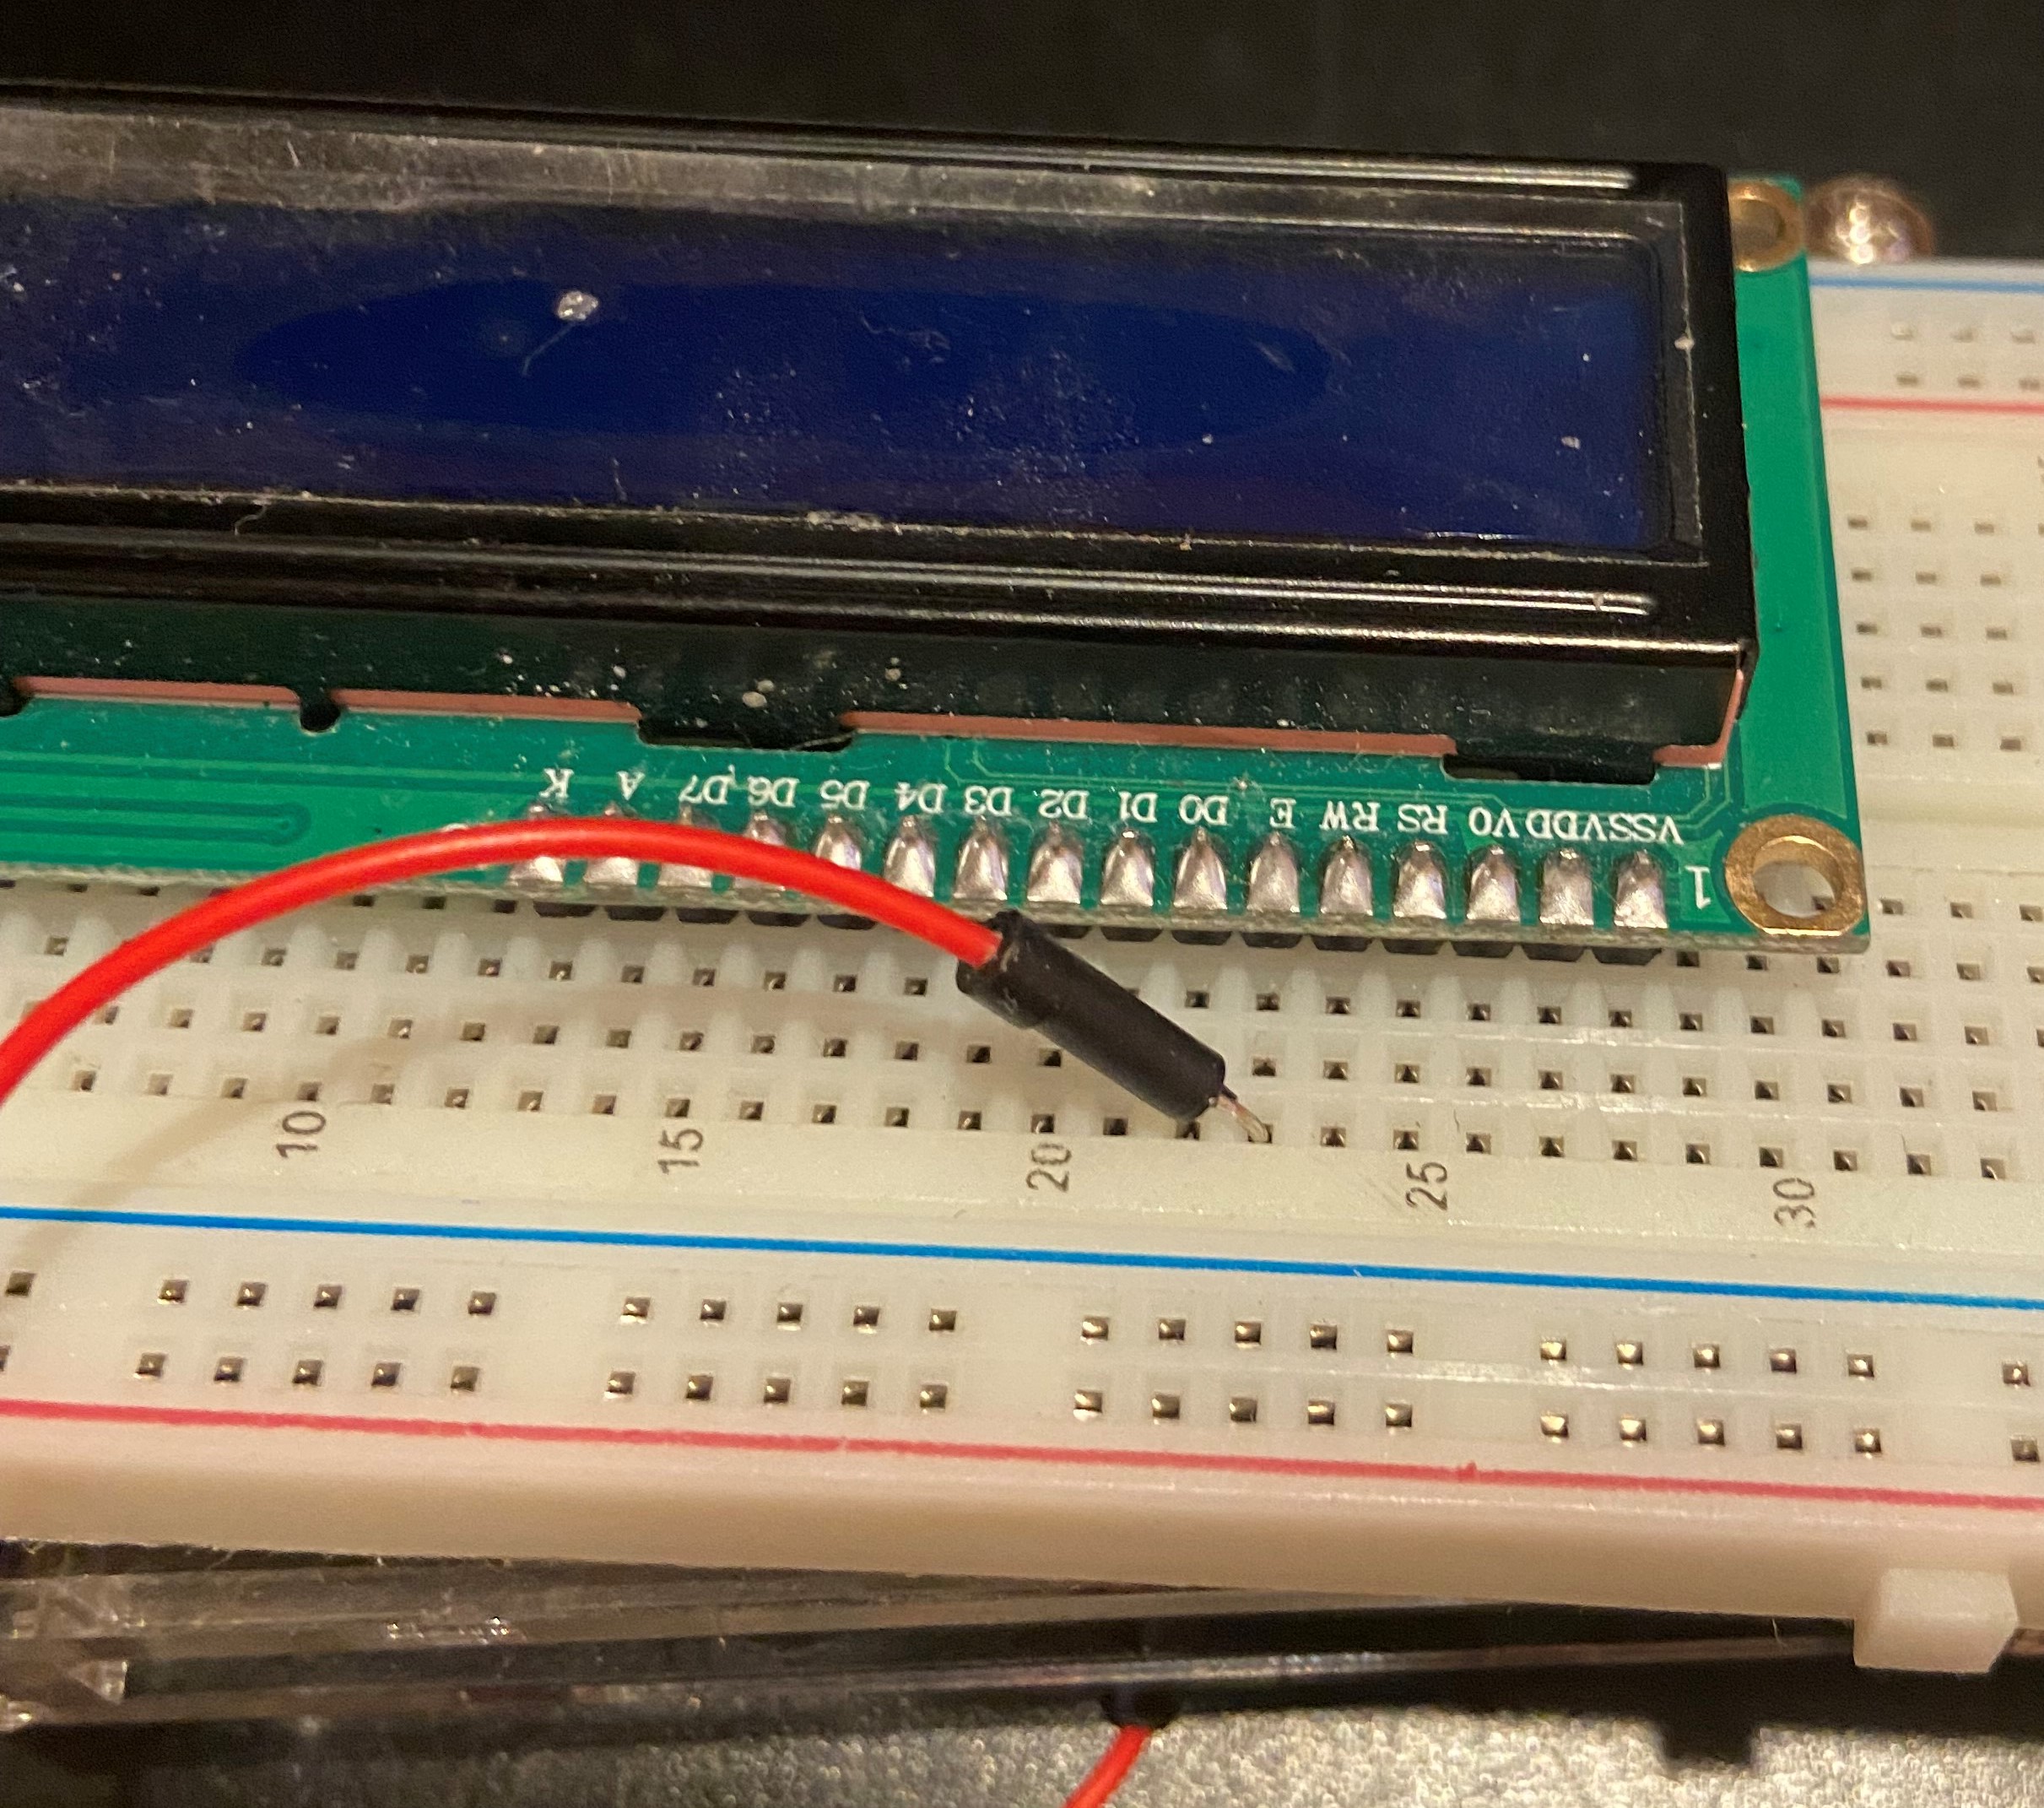
-The last wire on this side of the Arduino to connect the Arduino to the breadboard is an orange wire in Arduino 7 that ends in breadboard 25a.
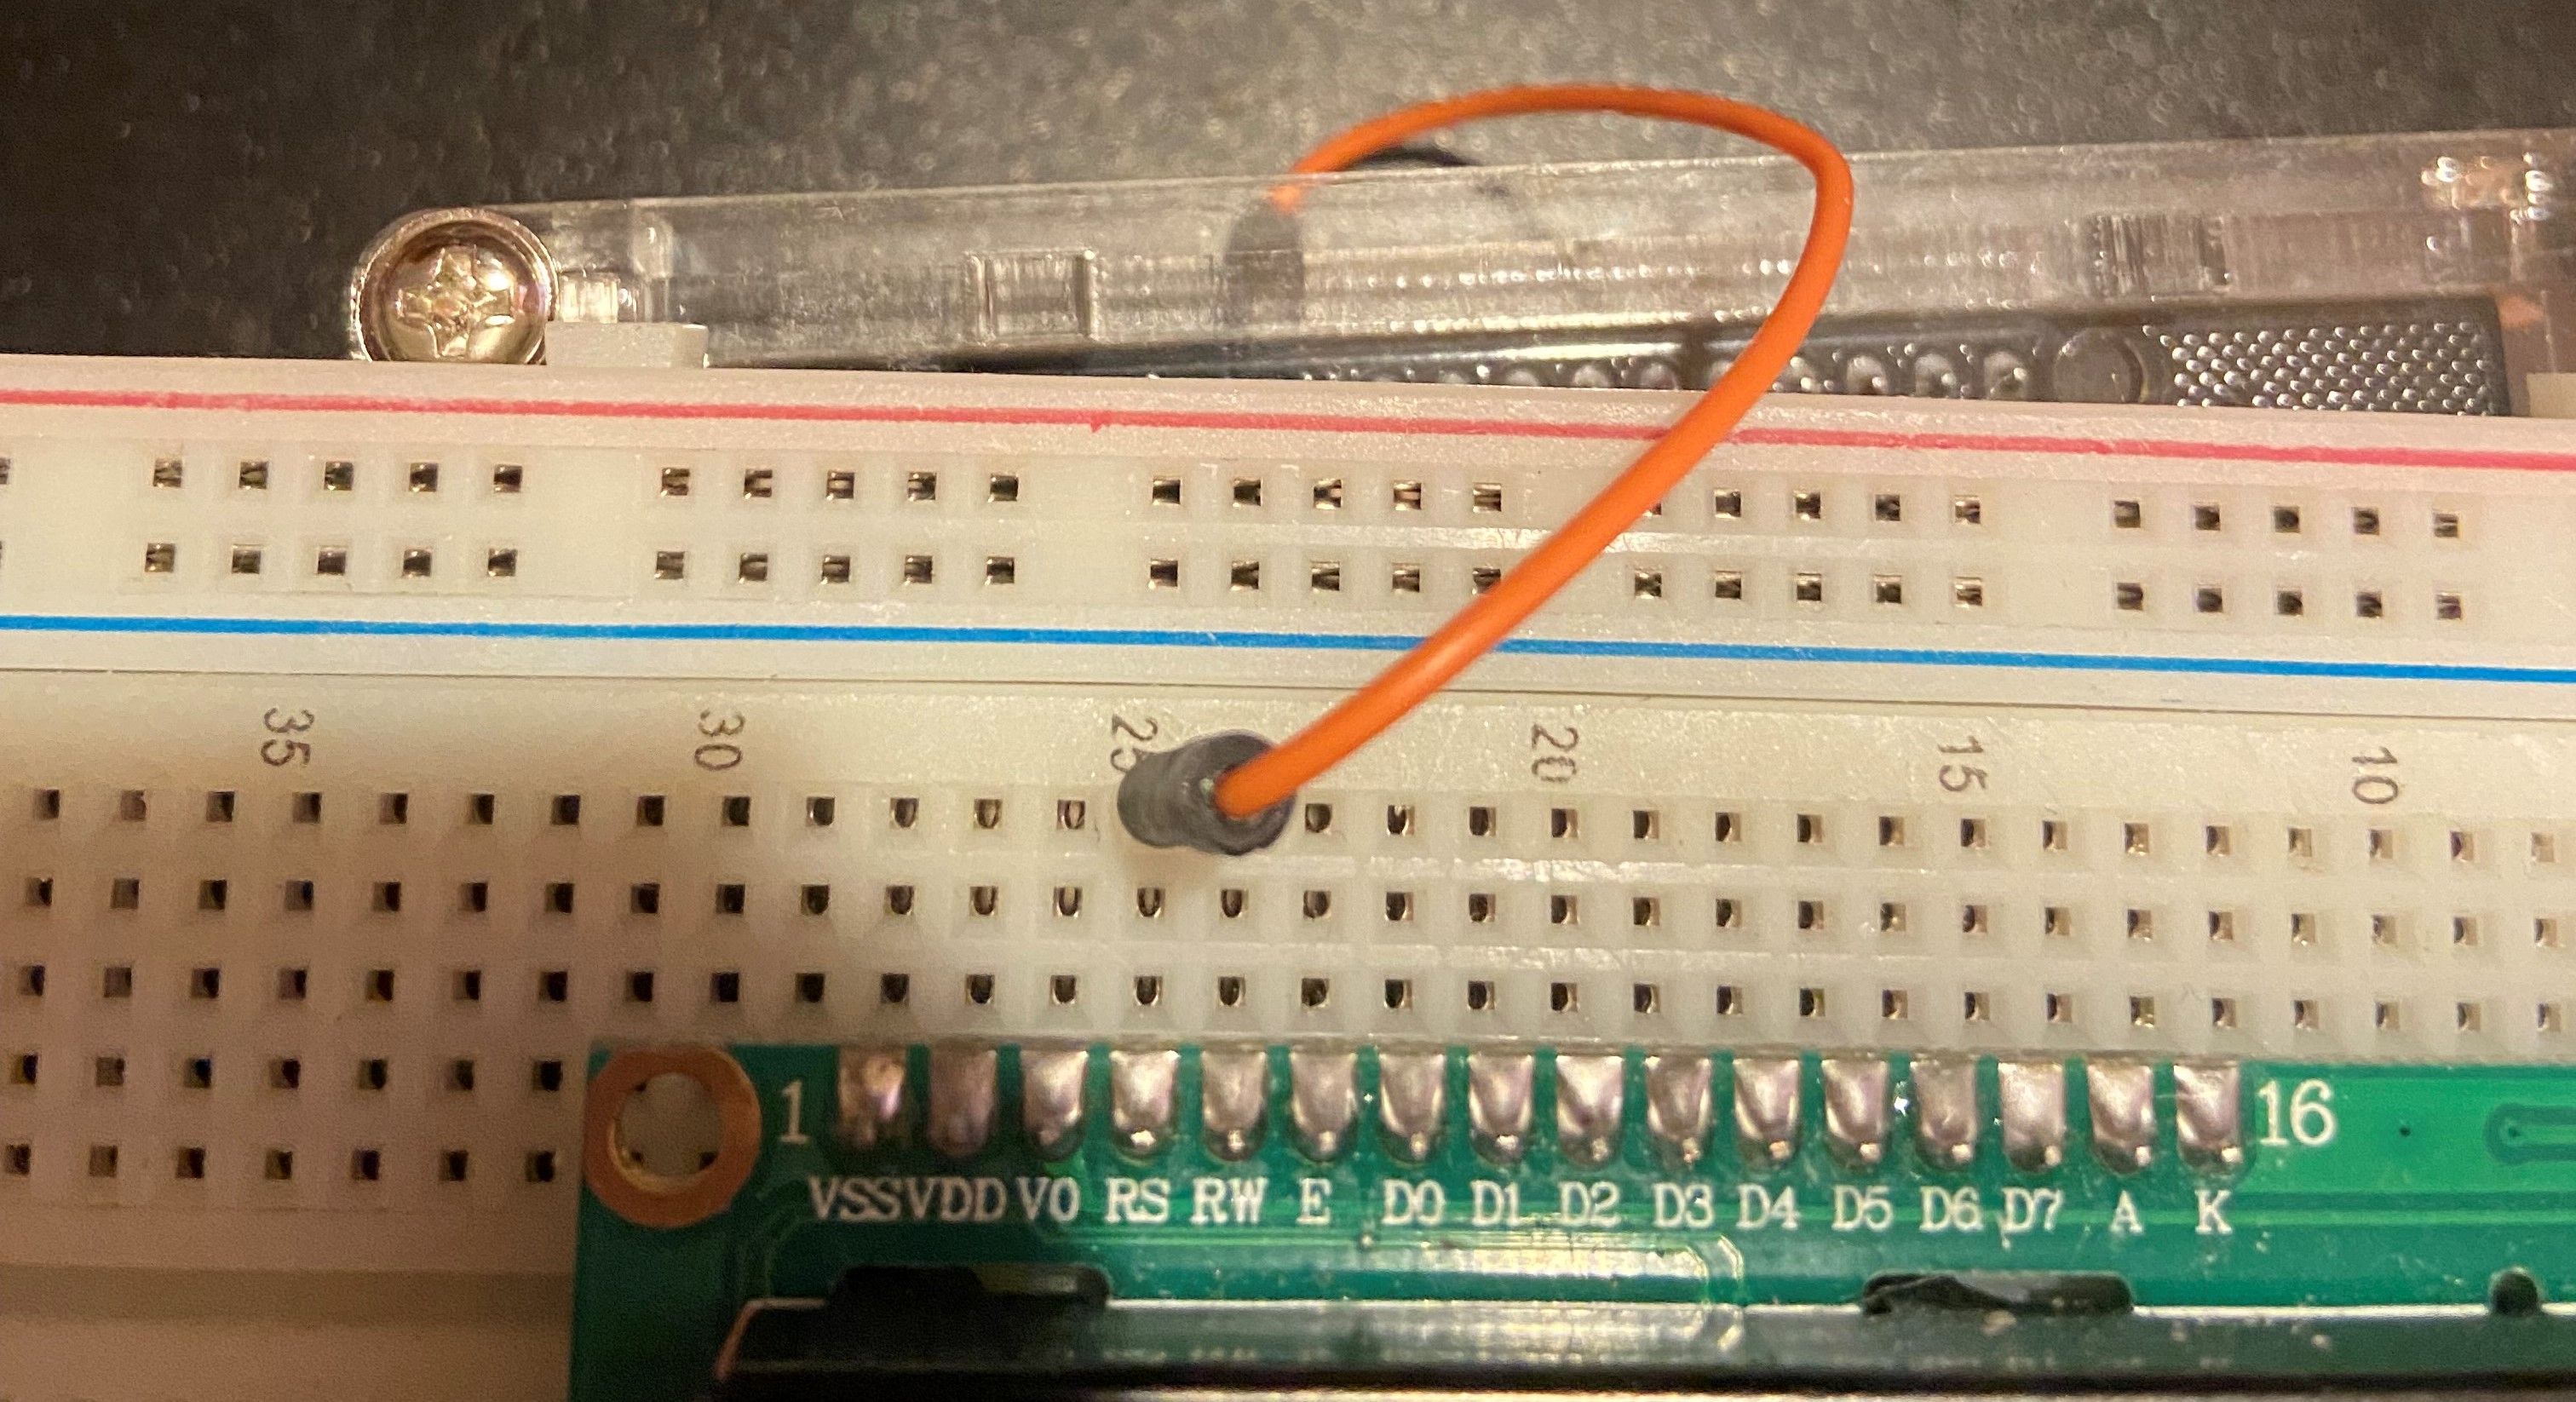
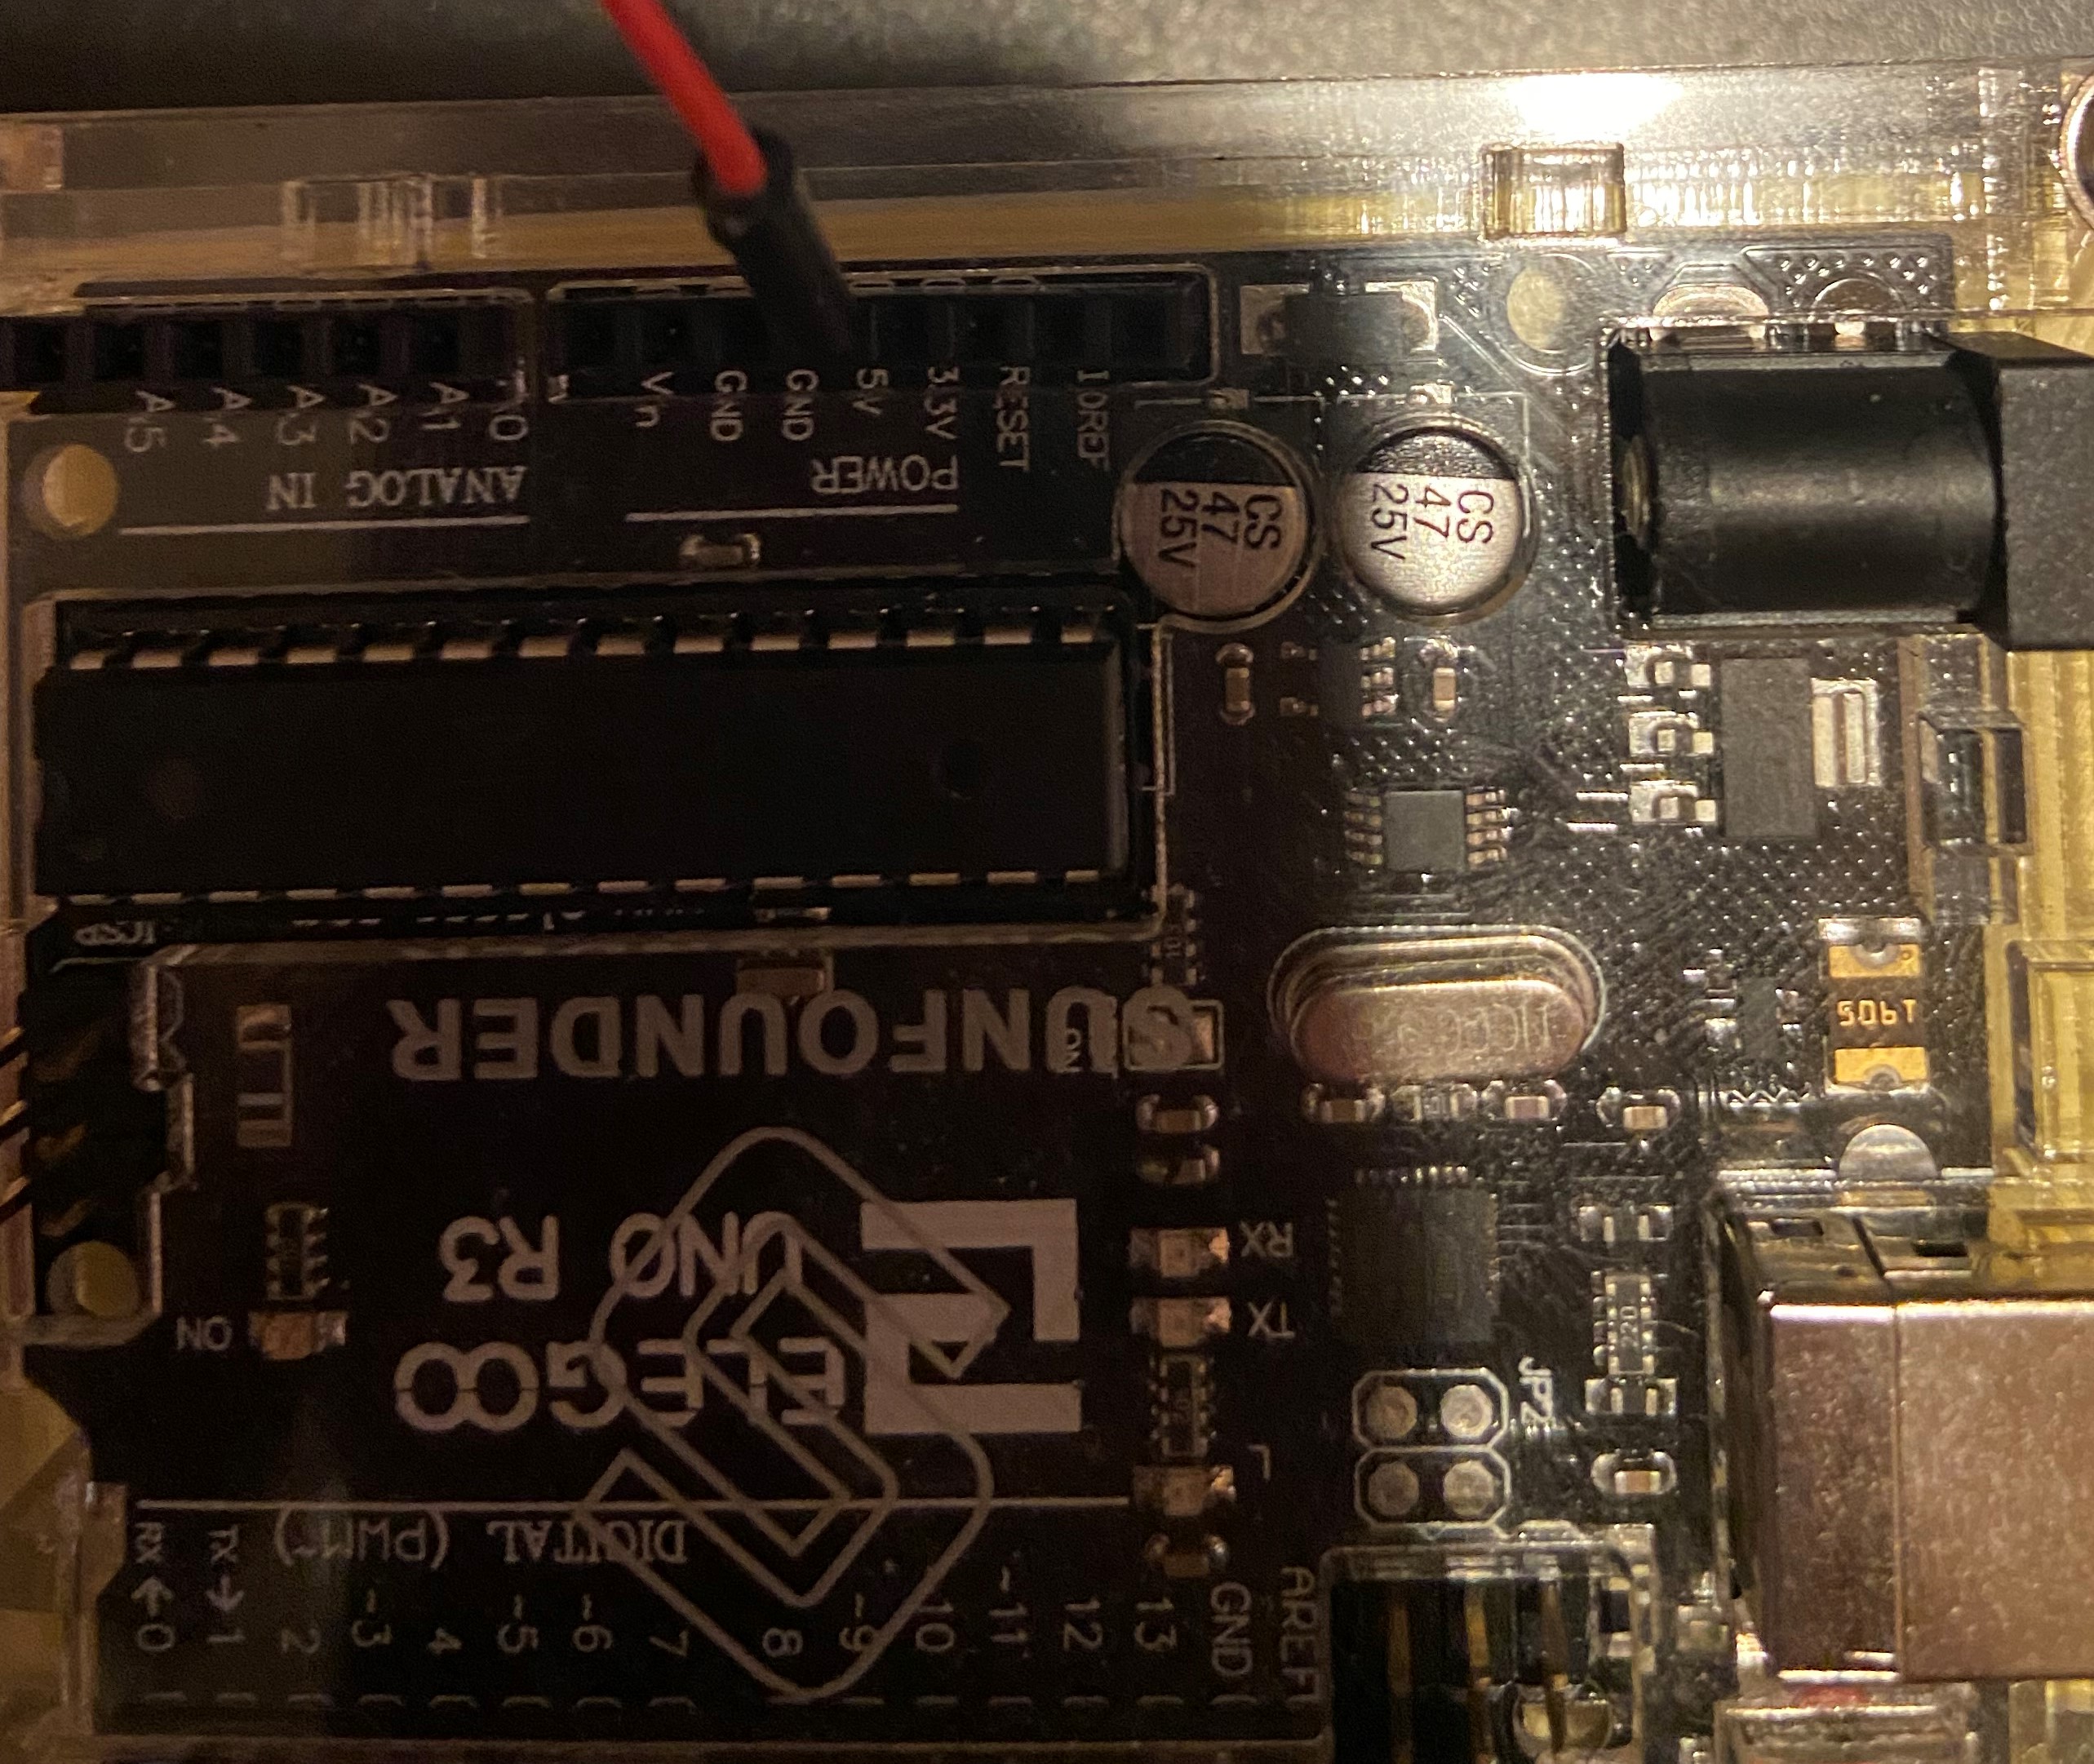
The last wire connects on the opposite side of the Arduino in the 5v slot and ends in the 39+ spot of the breadboard. Next we will connect the Arduino to the laser particle sensor.
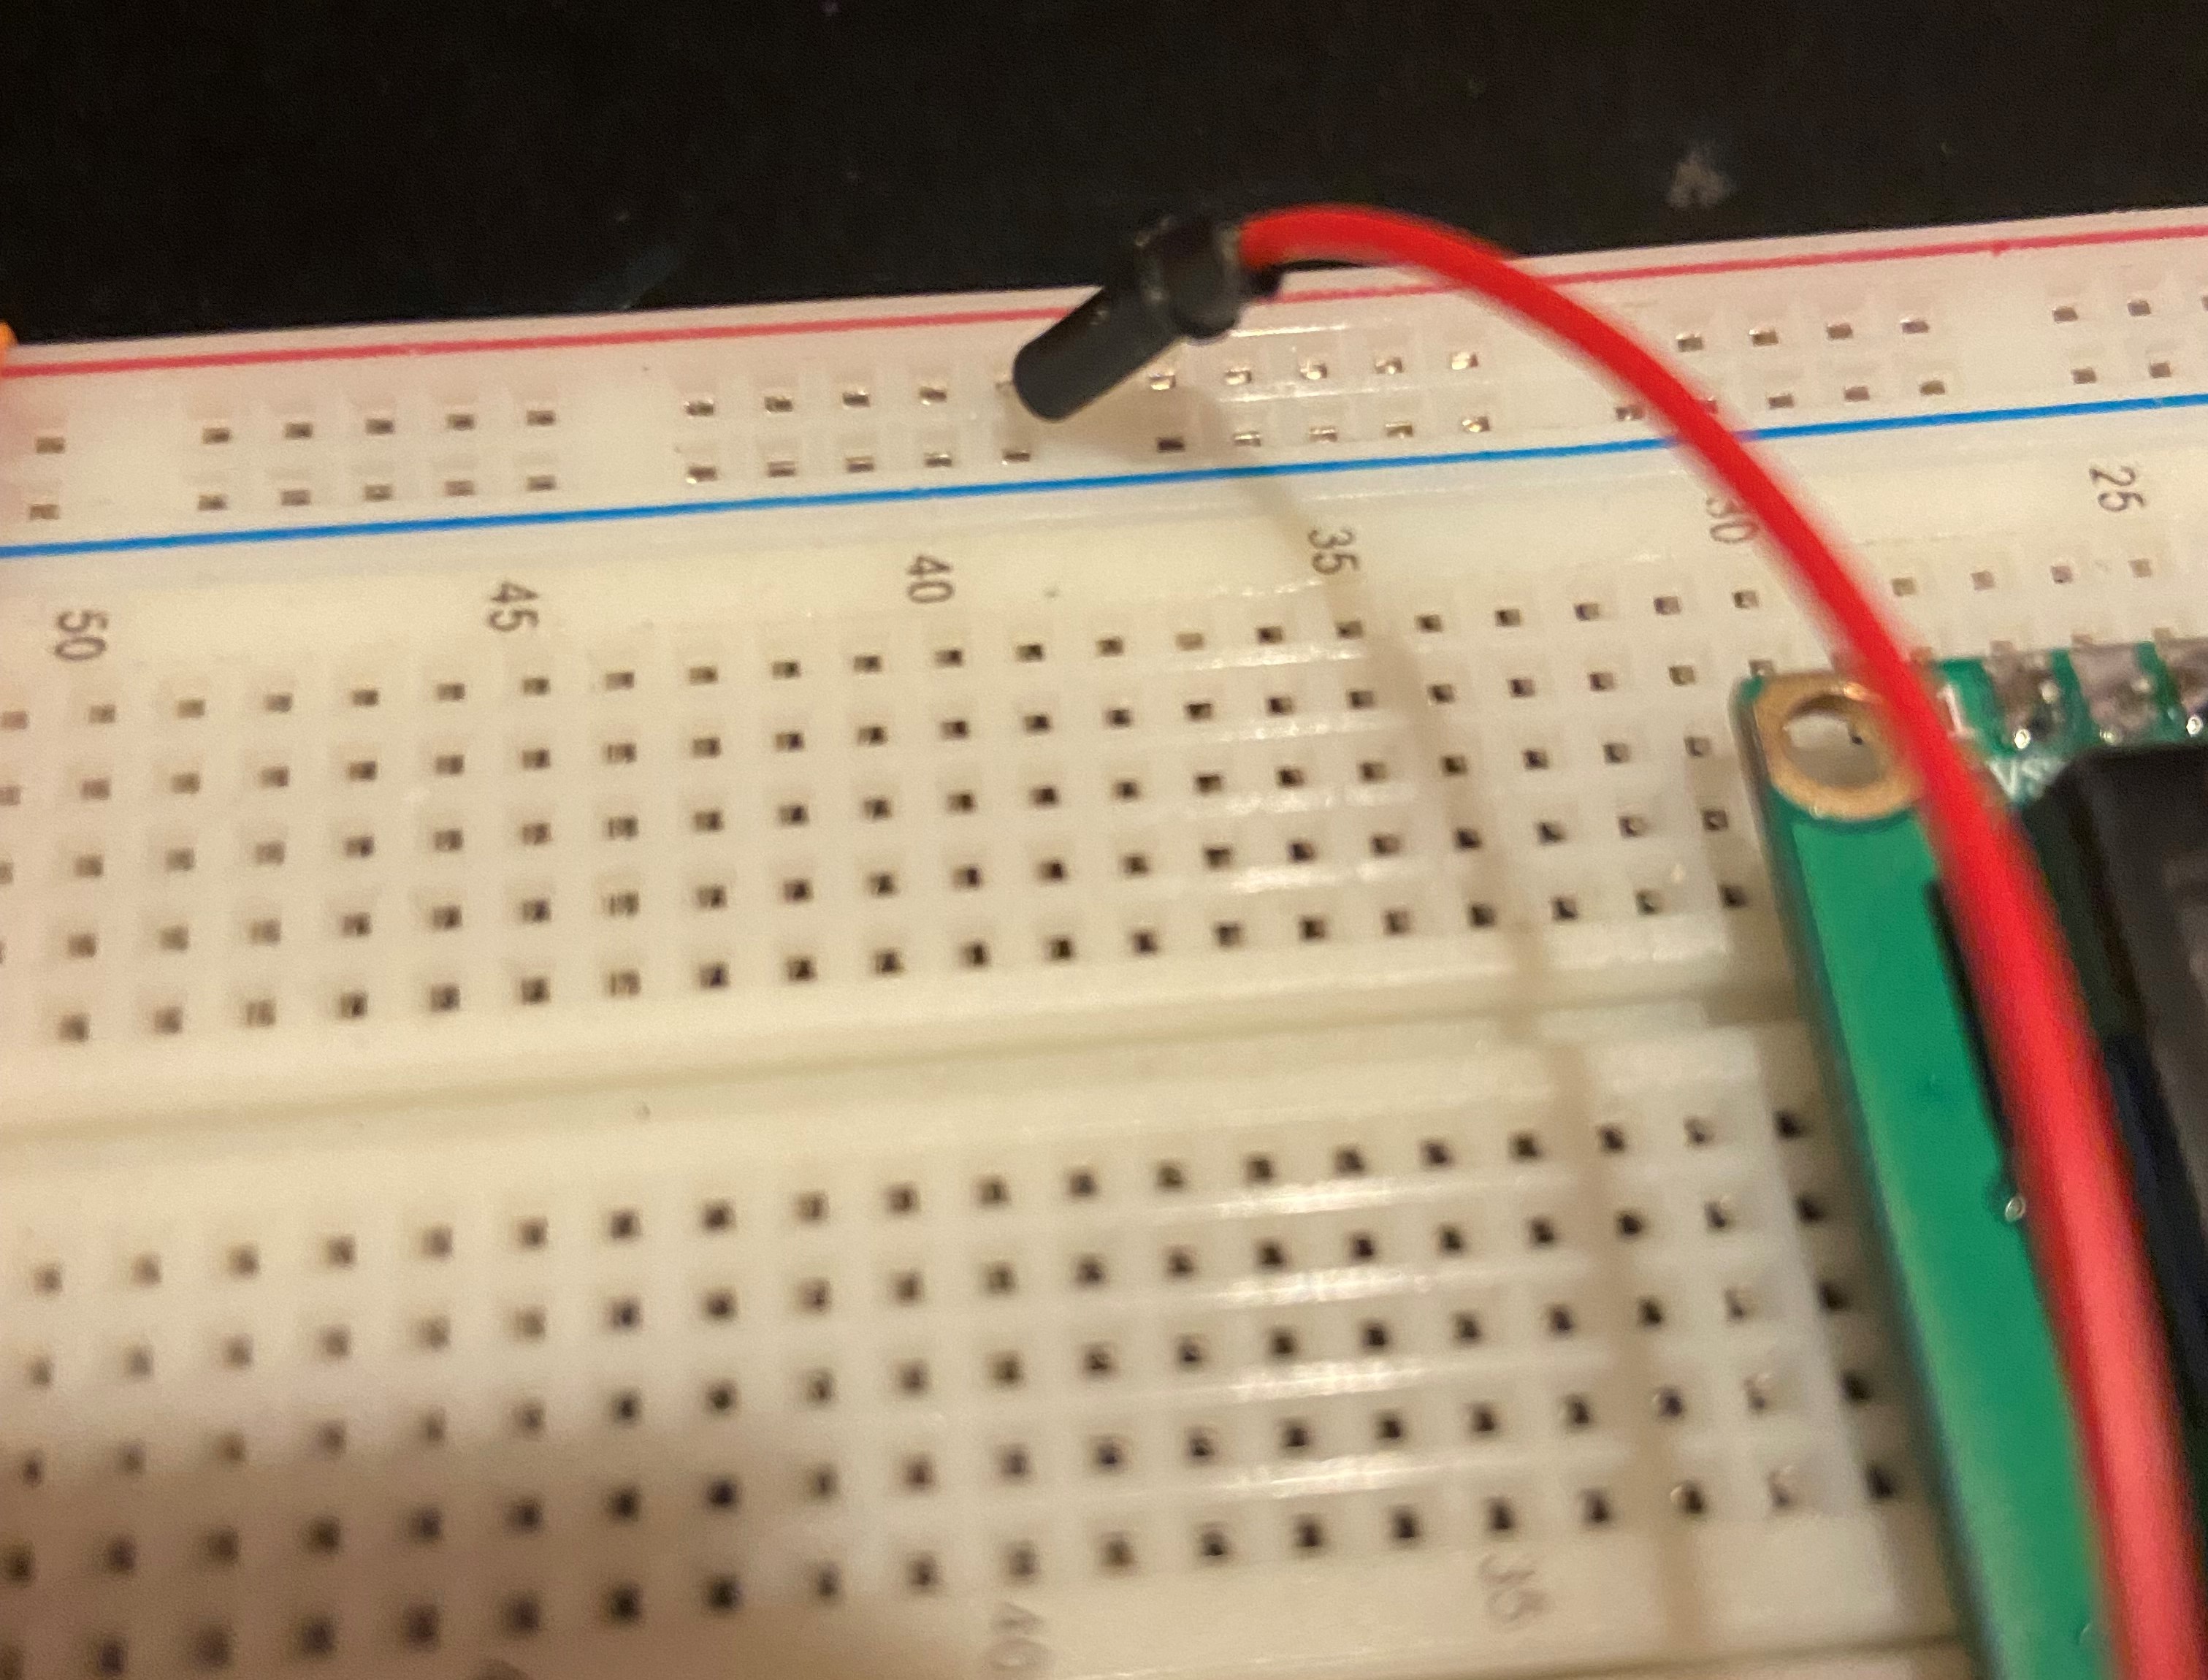
This next component only consists of one wire: a yellow wire in Arduino 4 connecting to the second left most node on the laser particle sensor. Next we will connect the laser particle sensor to the breadboard and finally we will do a bit of breadboard-breadboard connecting and you will be well on your way to testing the air quality wherever you want.
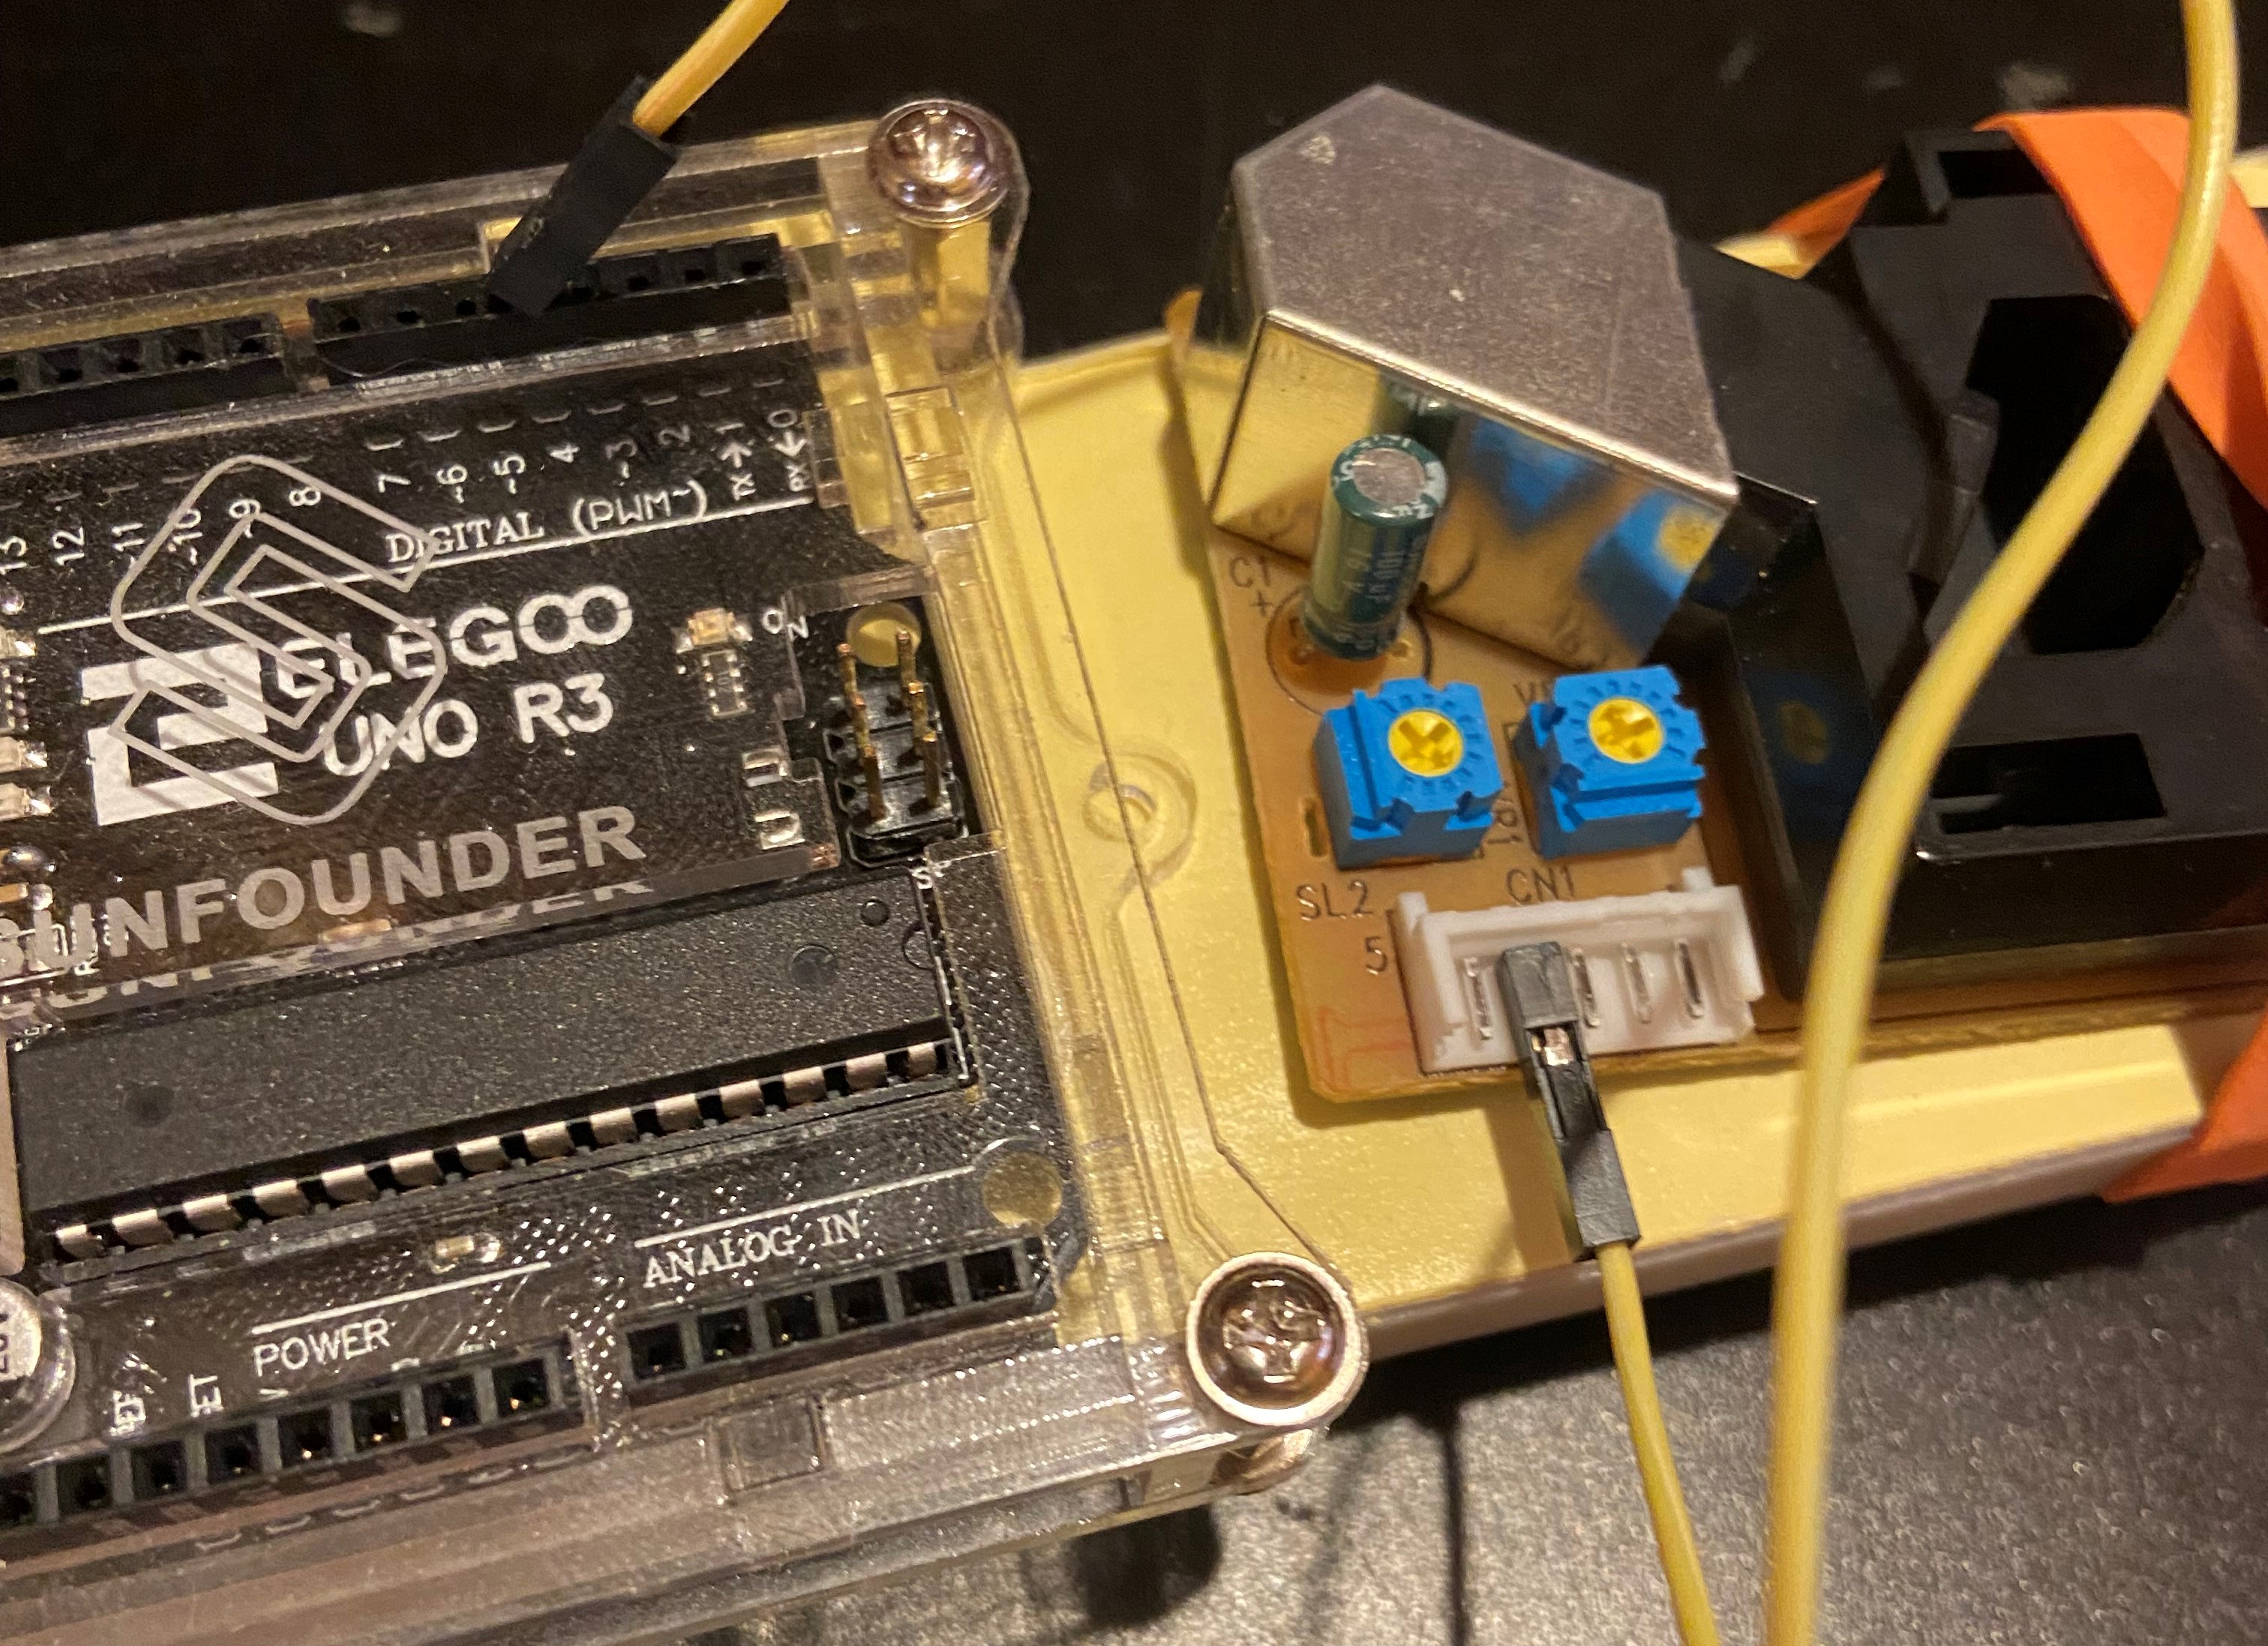
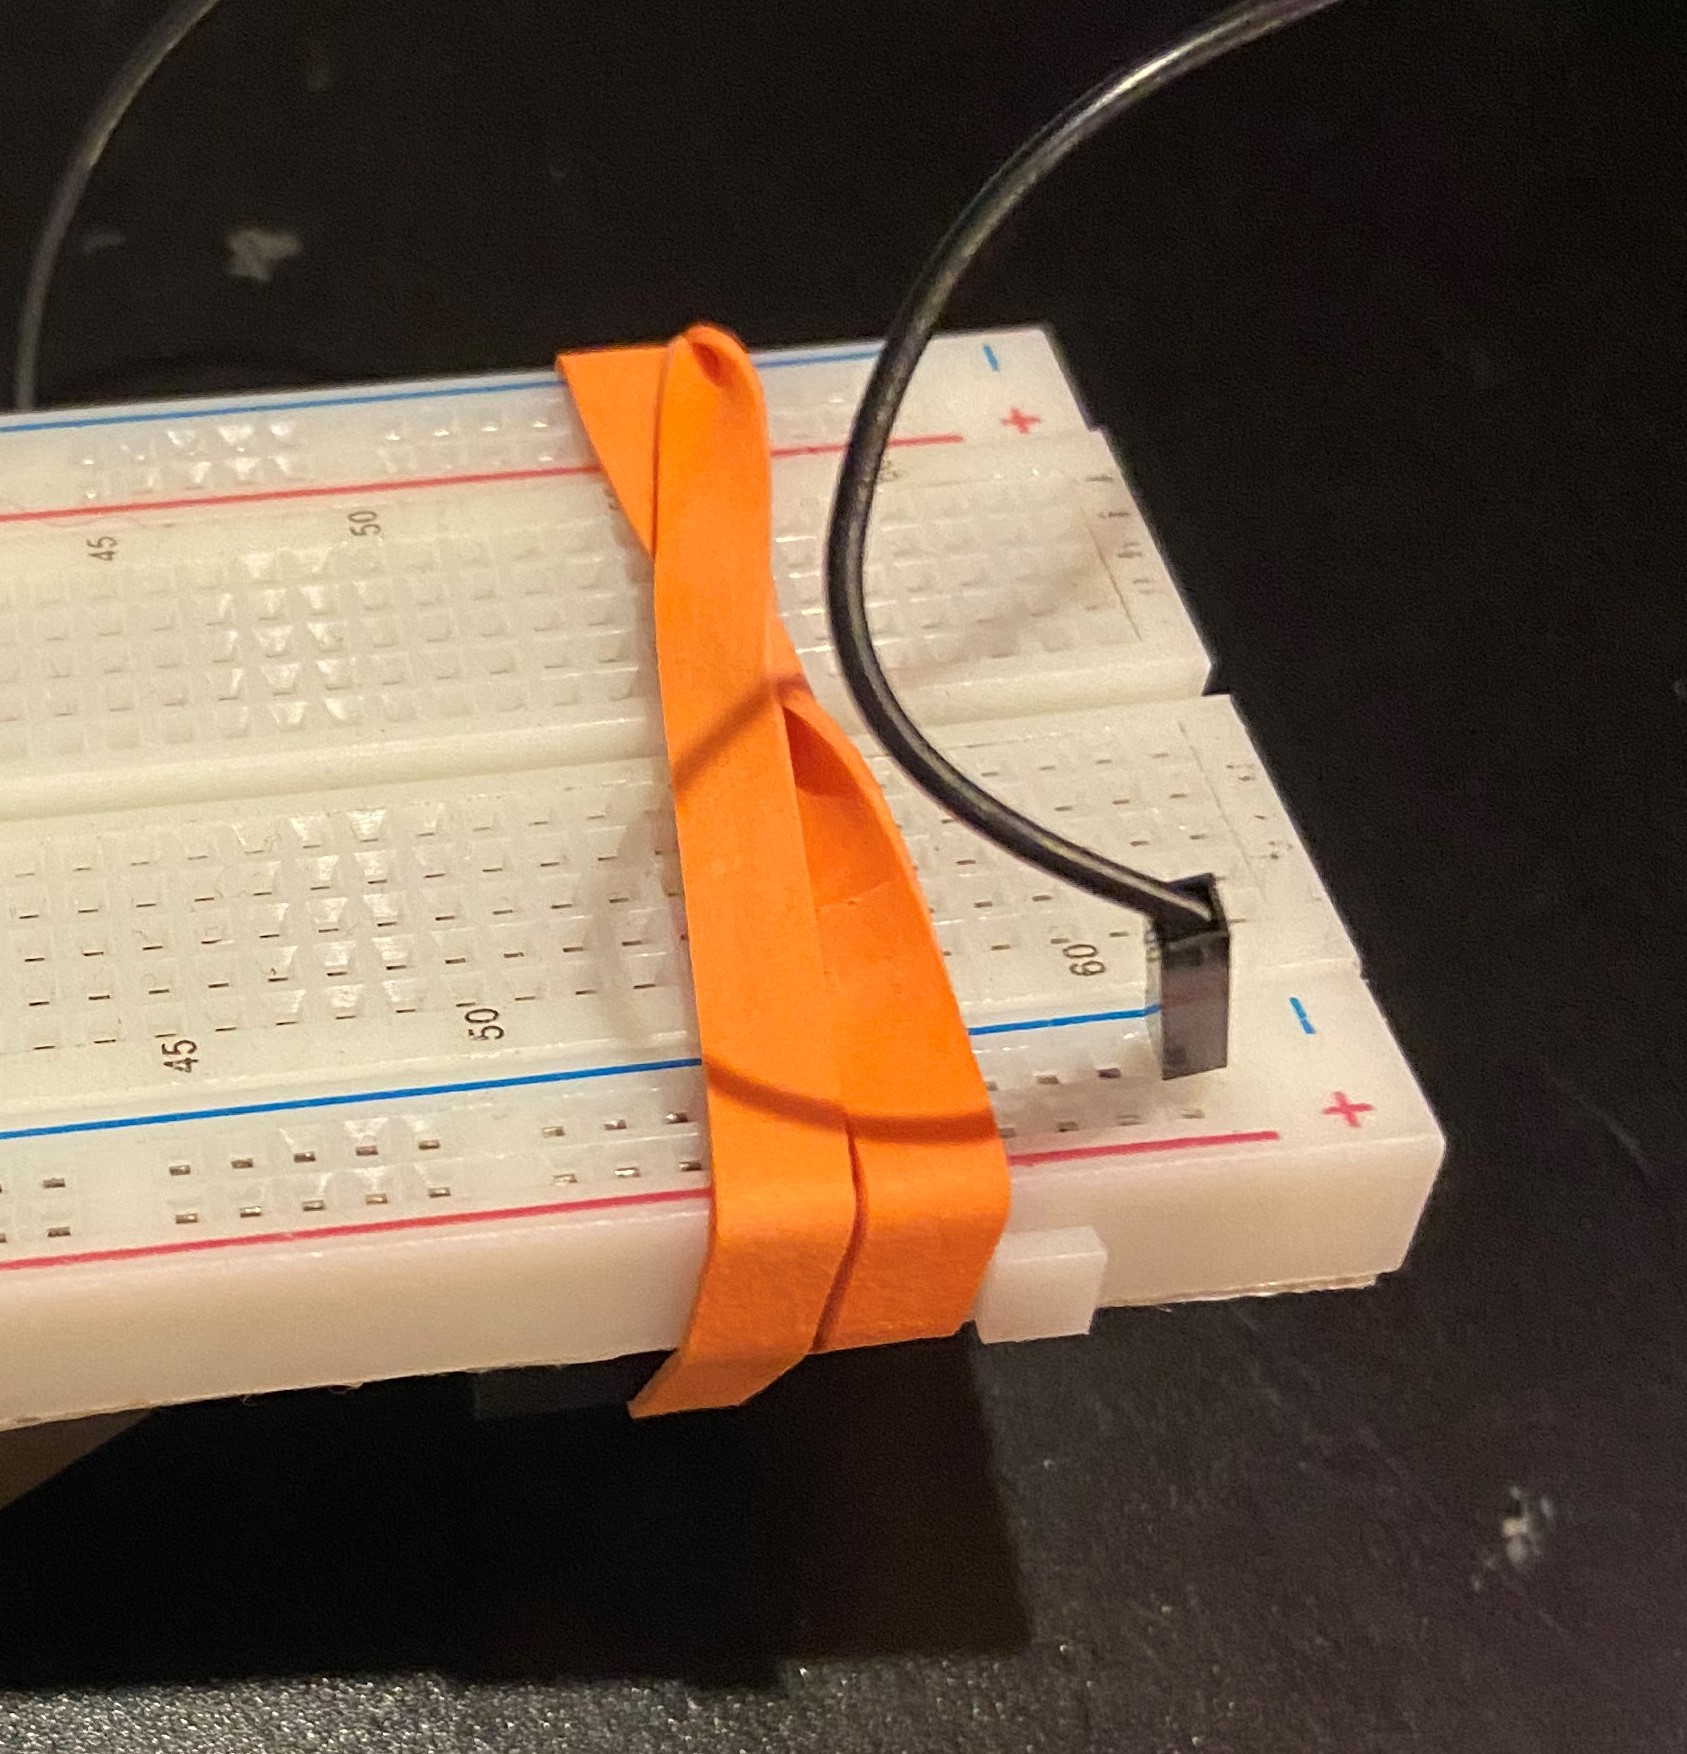
There are two wires to connect the laser particle sensor:
A red wire that plugs in directly to the right of the above yellow wire ending in breadboard 59+
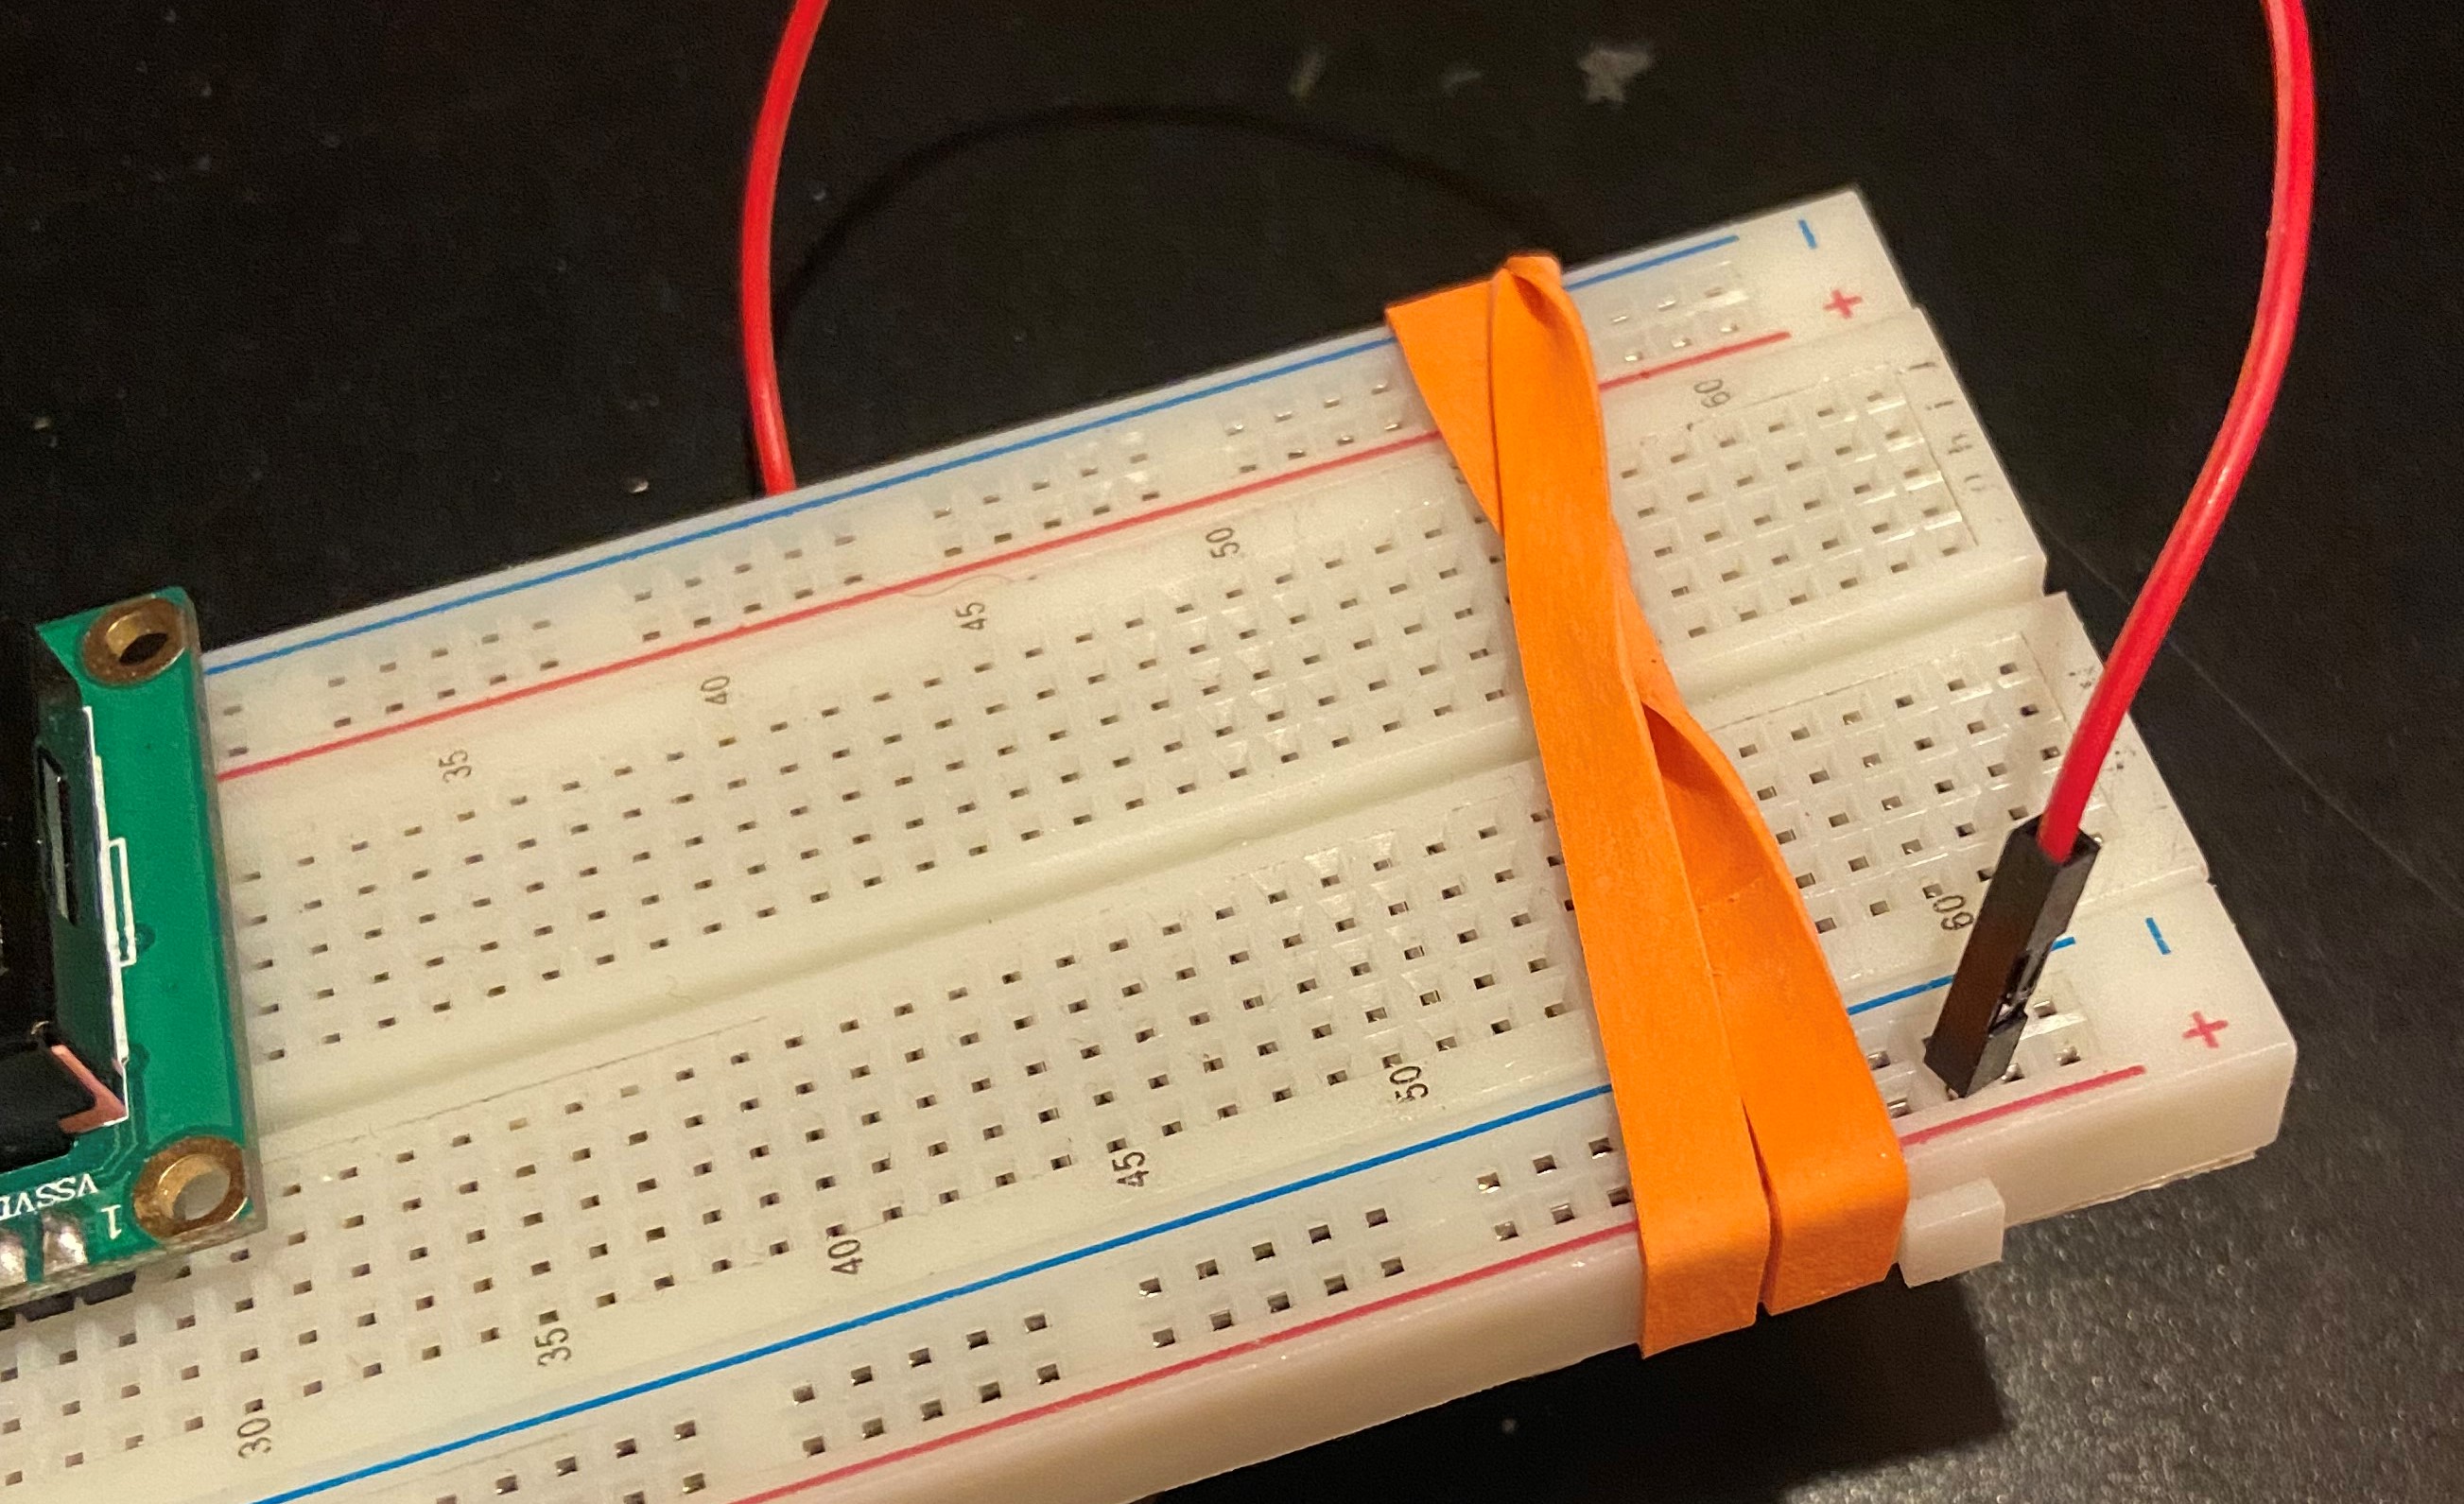
A black wire connects to the laser particle sensor two nodes to the right of the red wire ending in breadboard 61-. As said above, we will now move to the breadboard-breadboard connections!
In this section there are 7 connections needed to be made. Let's start with a red wire, plug this wire into breadboard 37- and 37c.
Connect a yellow wire to 35+ and 35c.
Next, connect a blue wire to 36g and 26b.
Another blue wire connects 27c and 27+. Two more wire connections!
Take a final blue wire and link 14b with 13+.
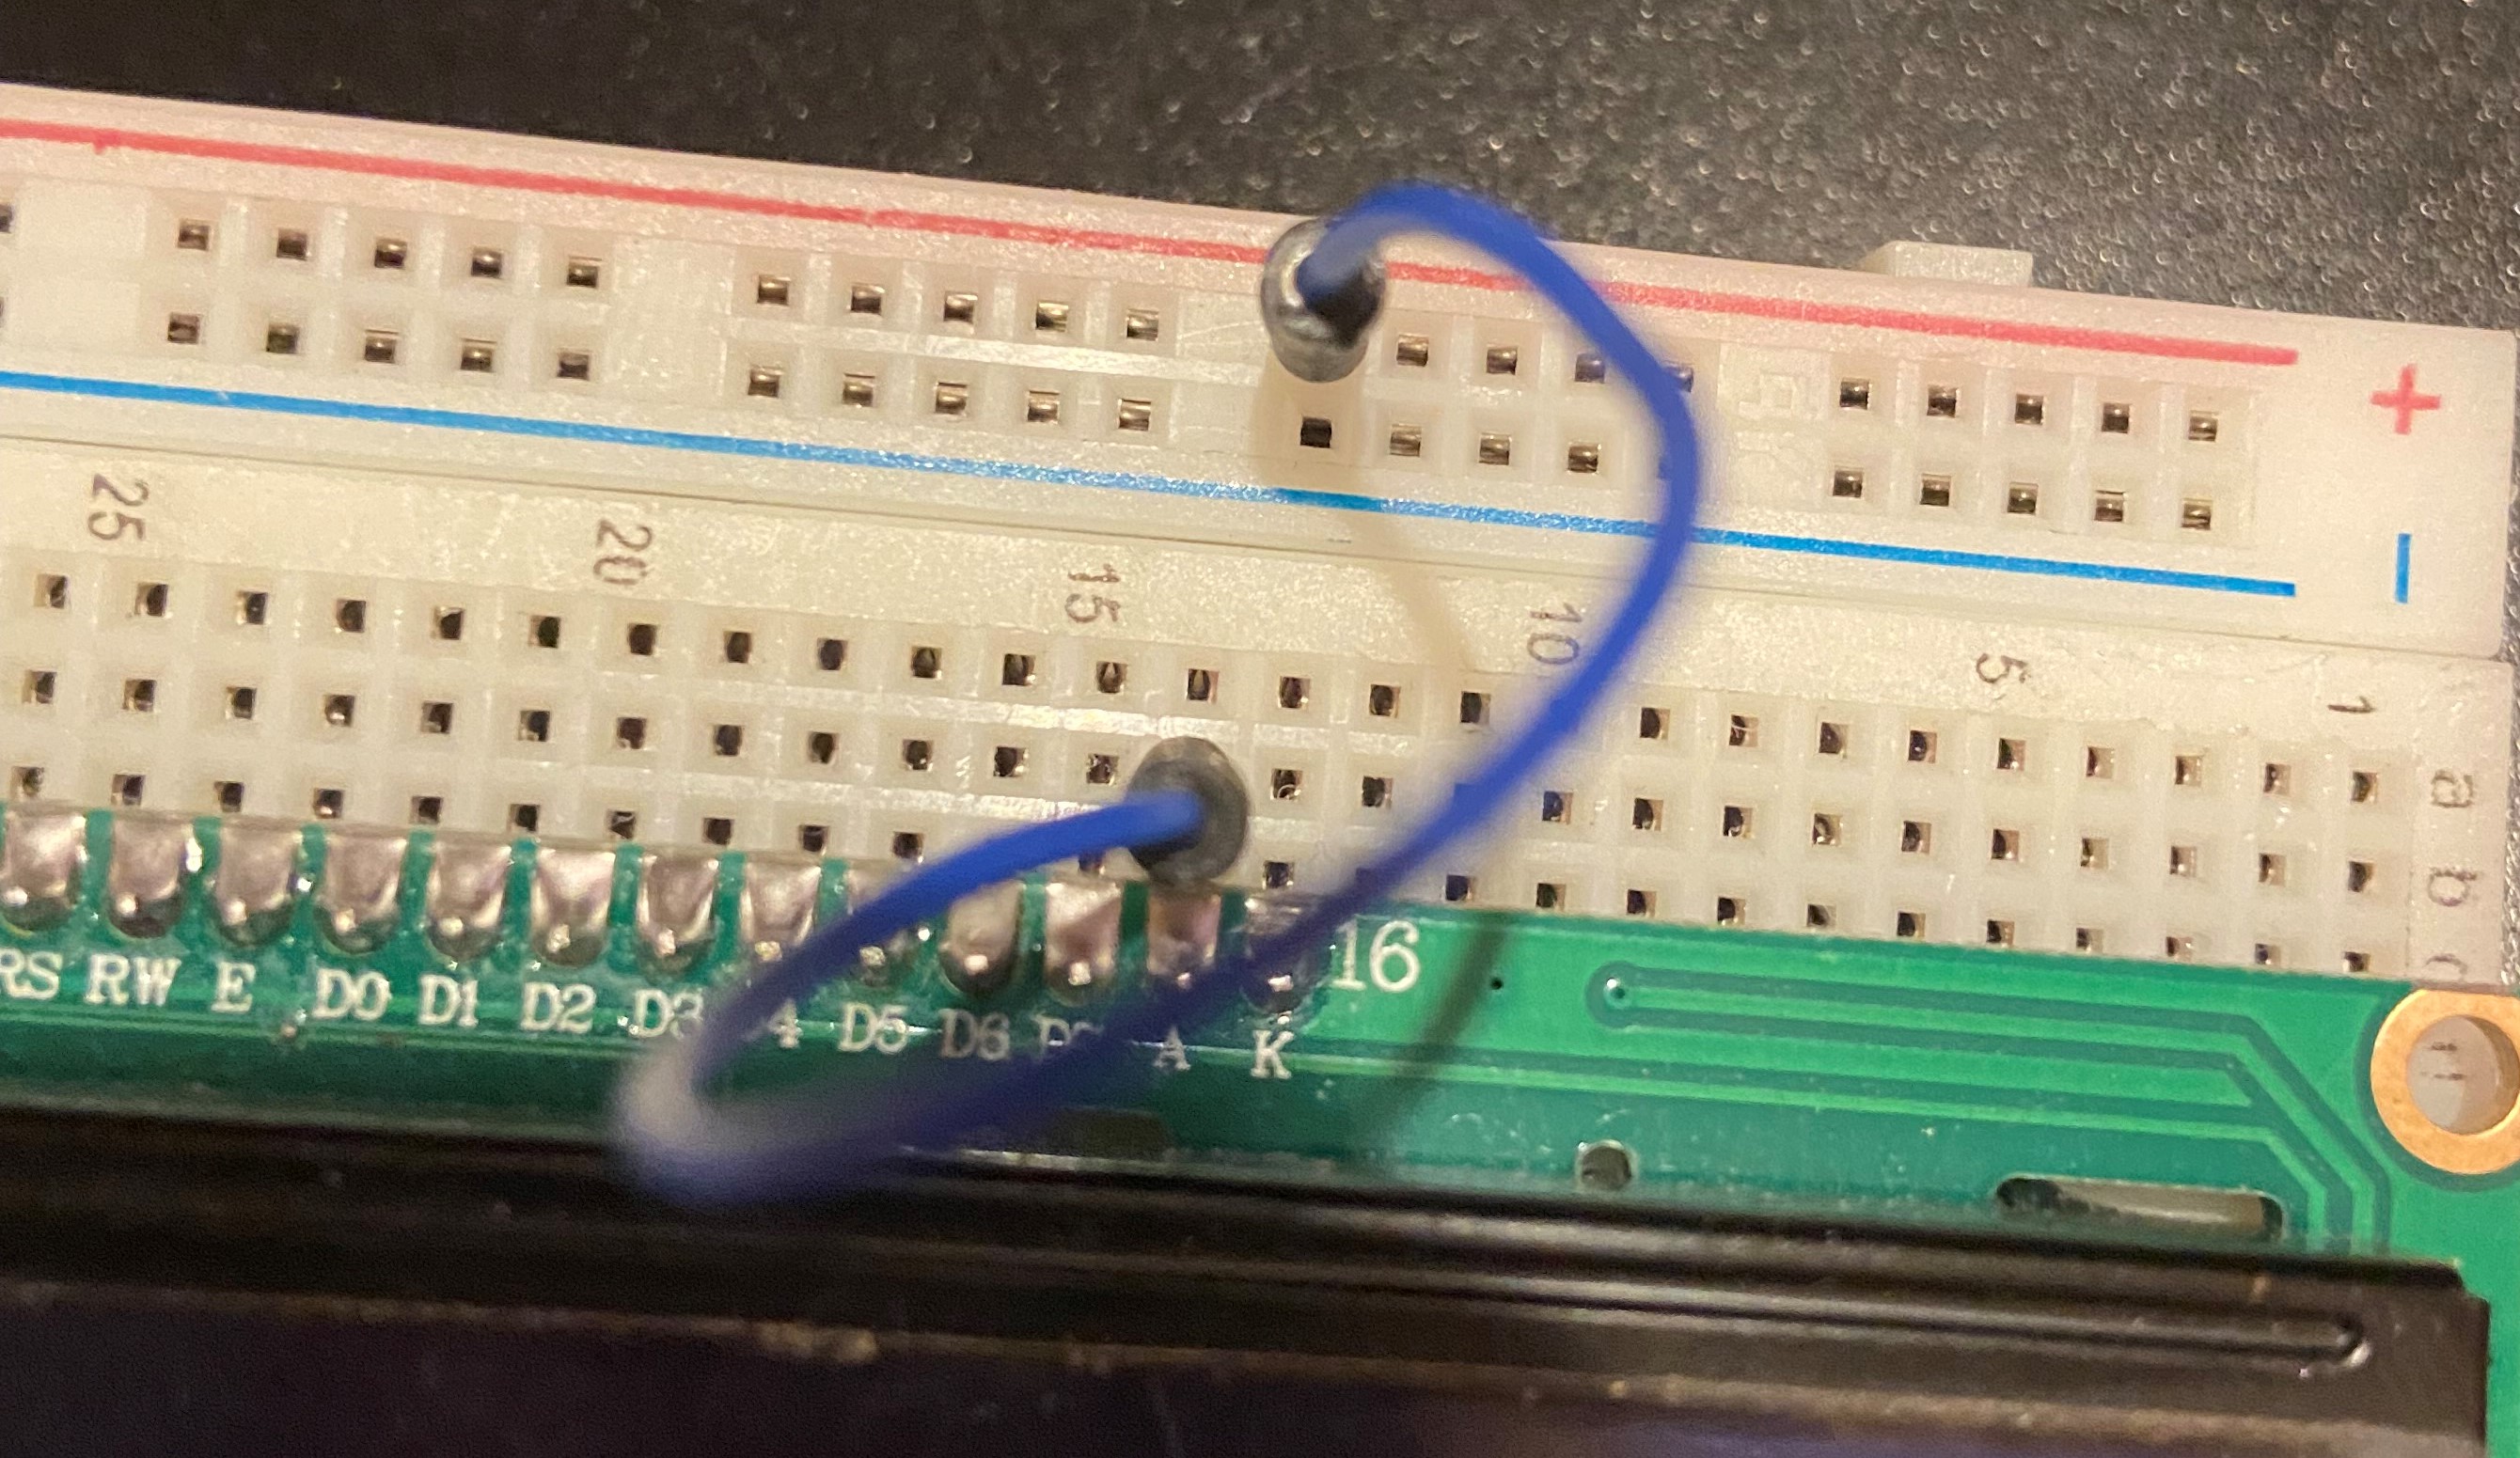
Finally, use a black wire to connect 13a with 12-.
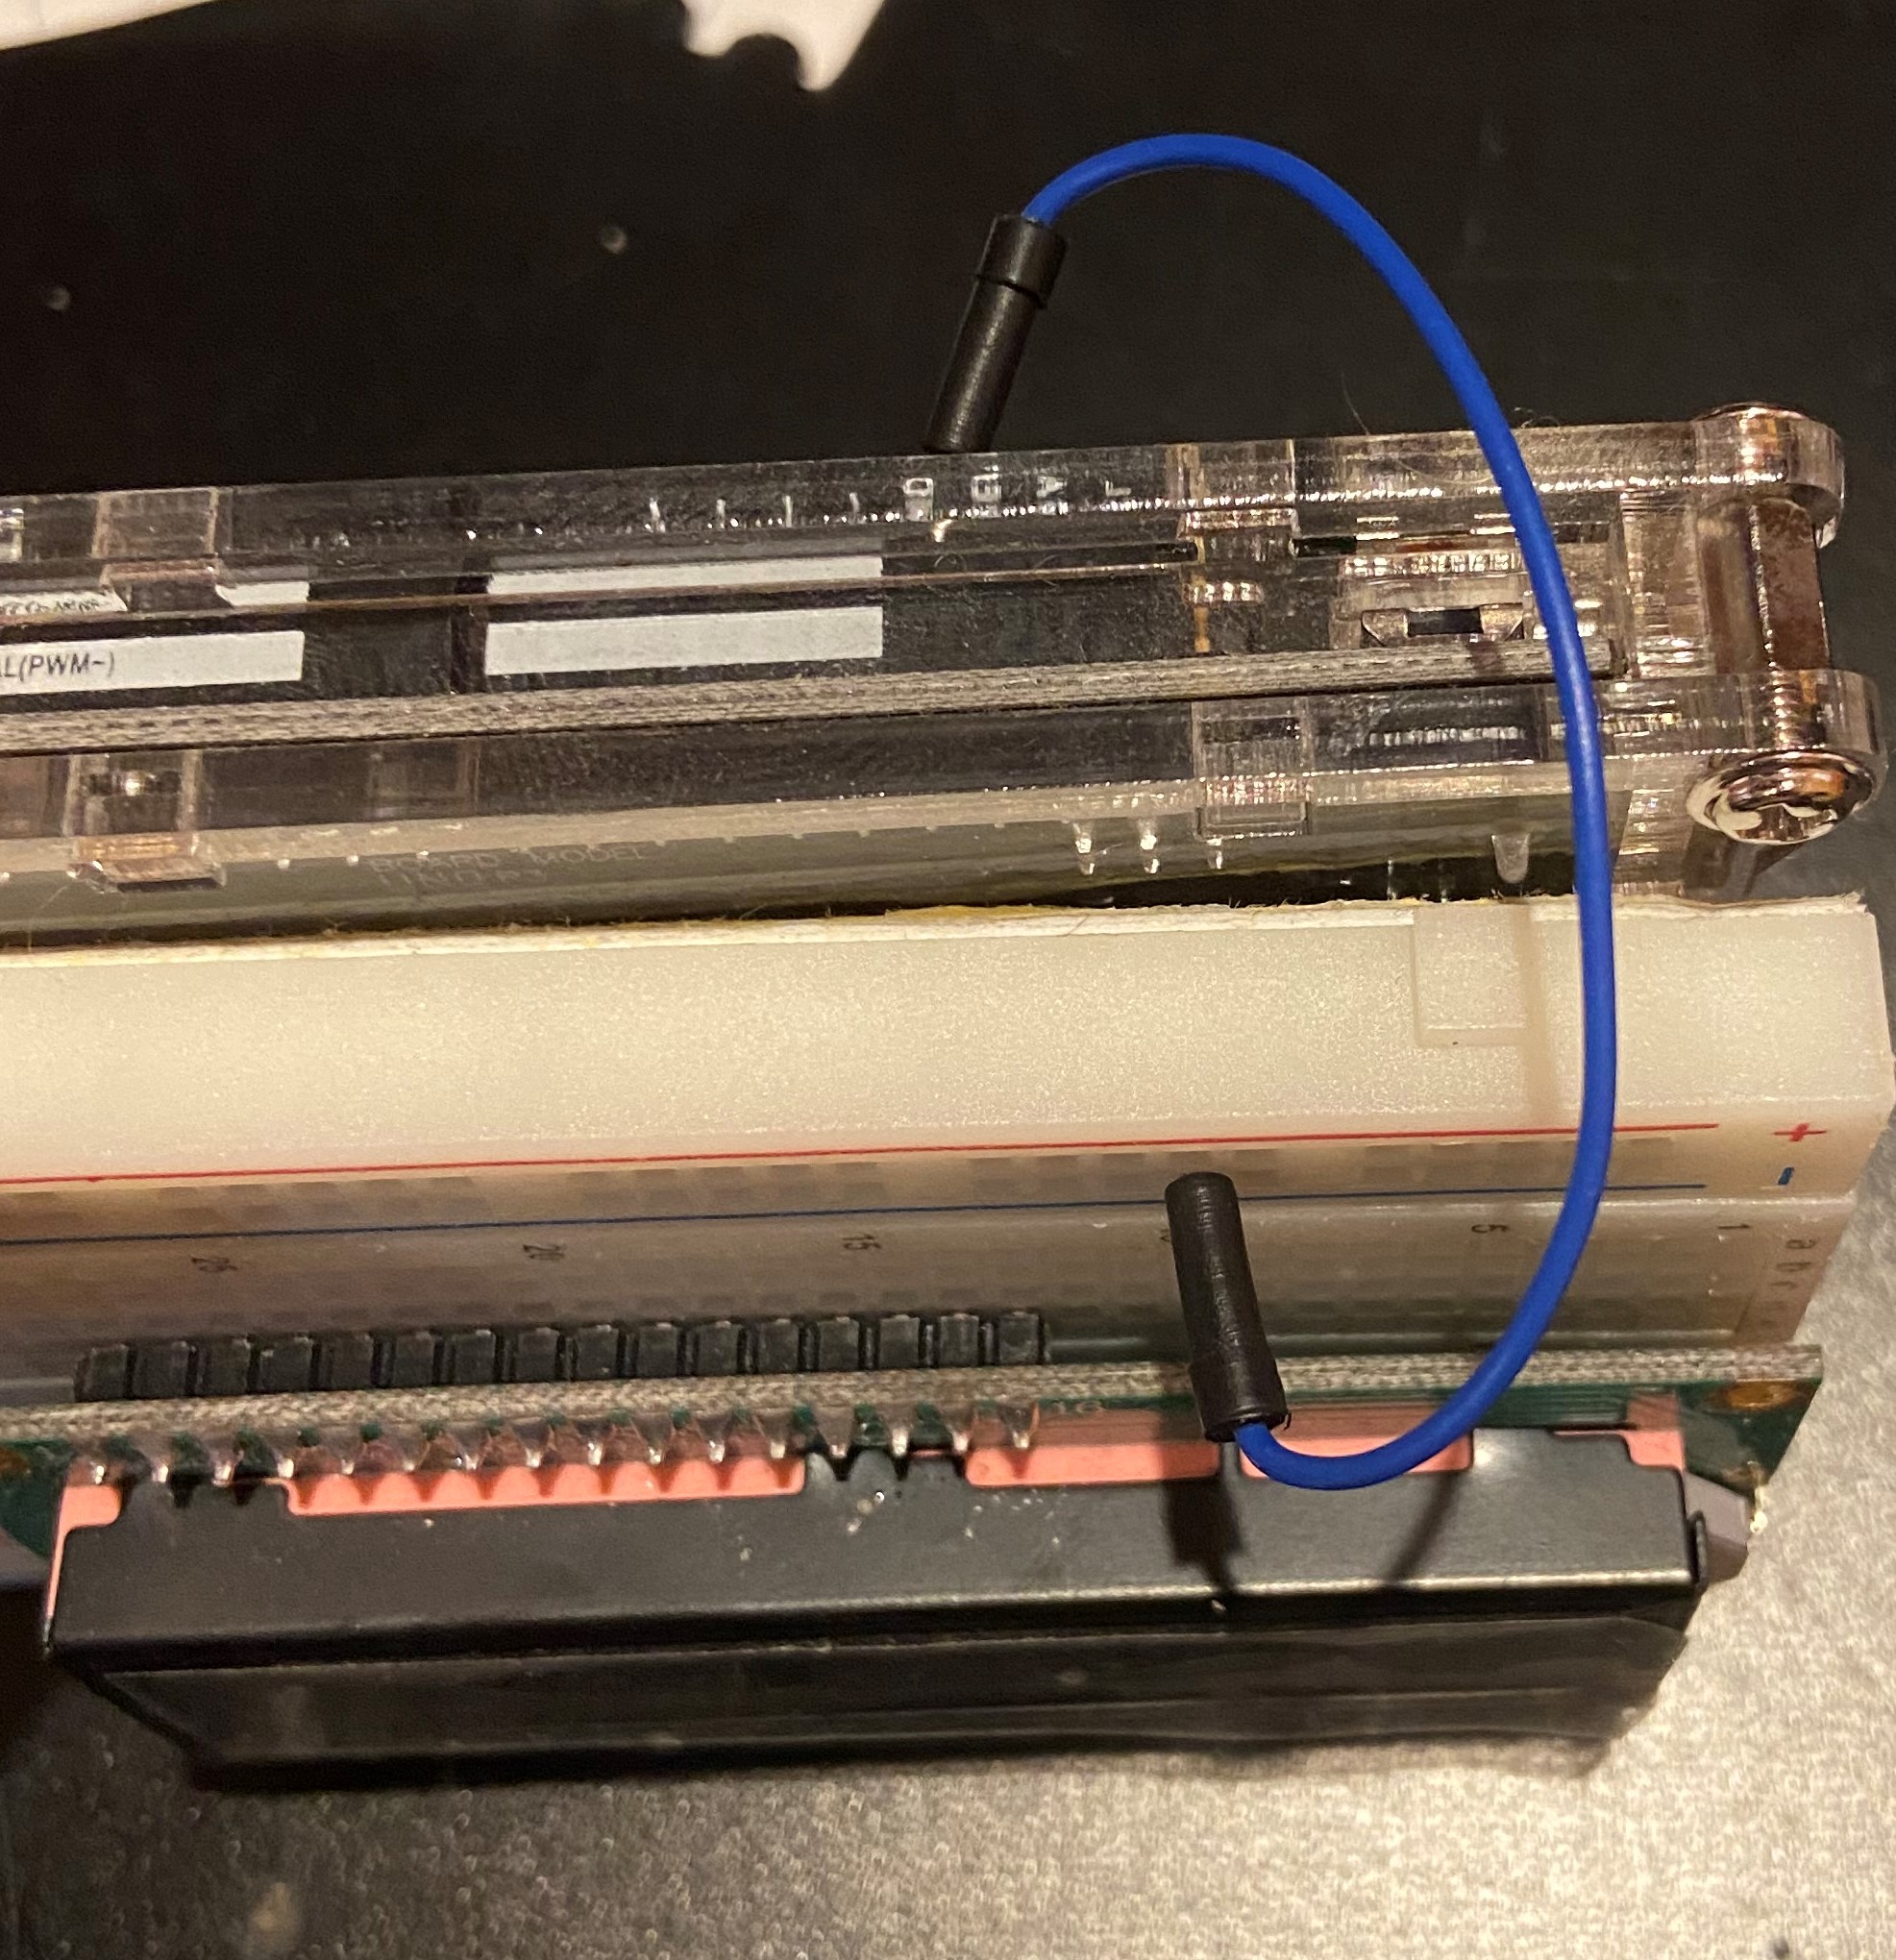
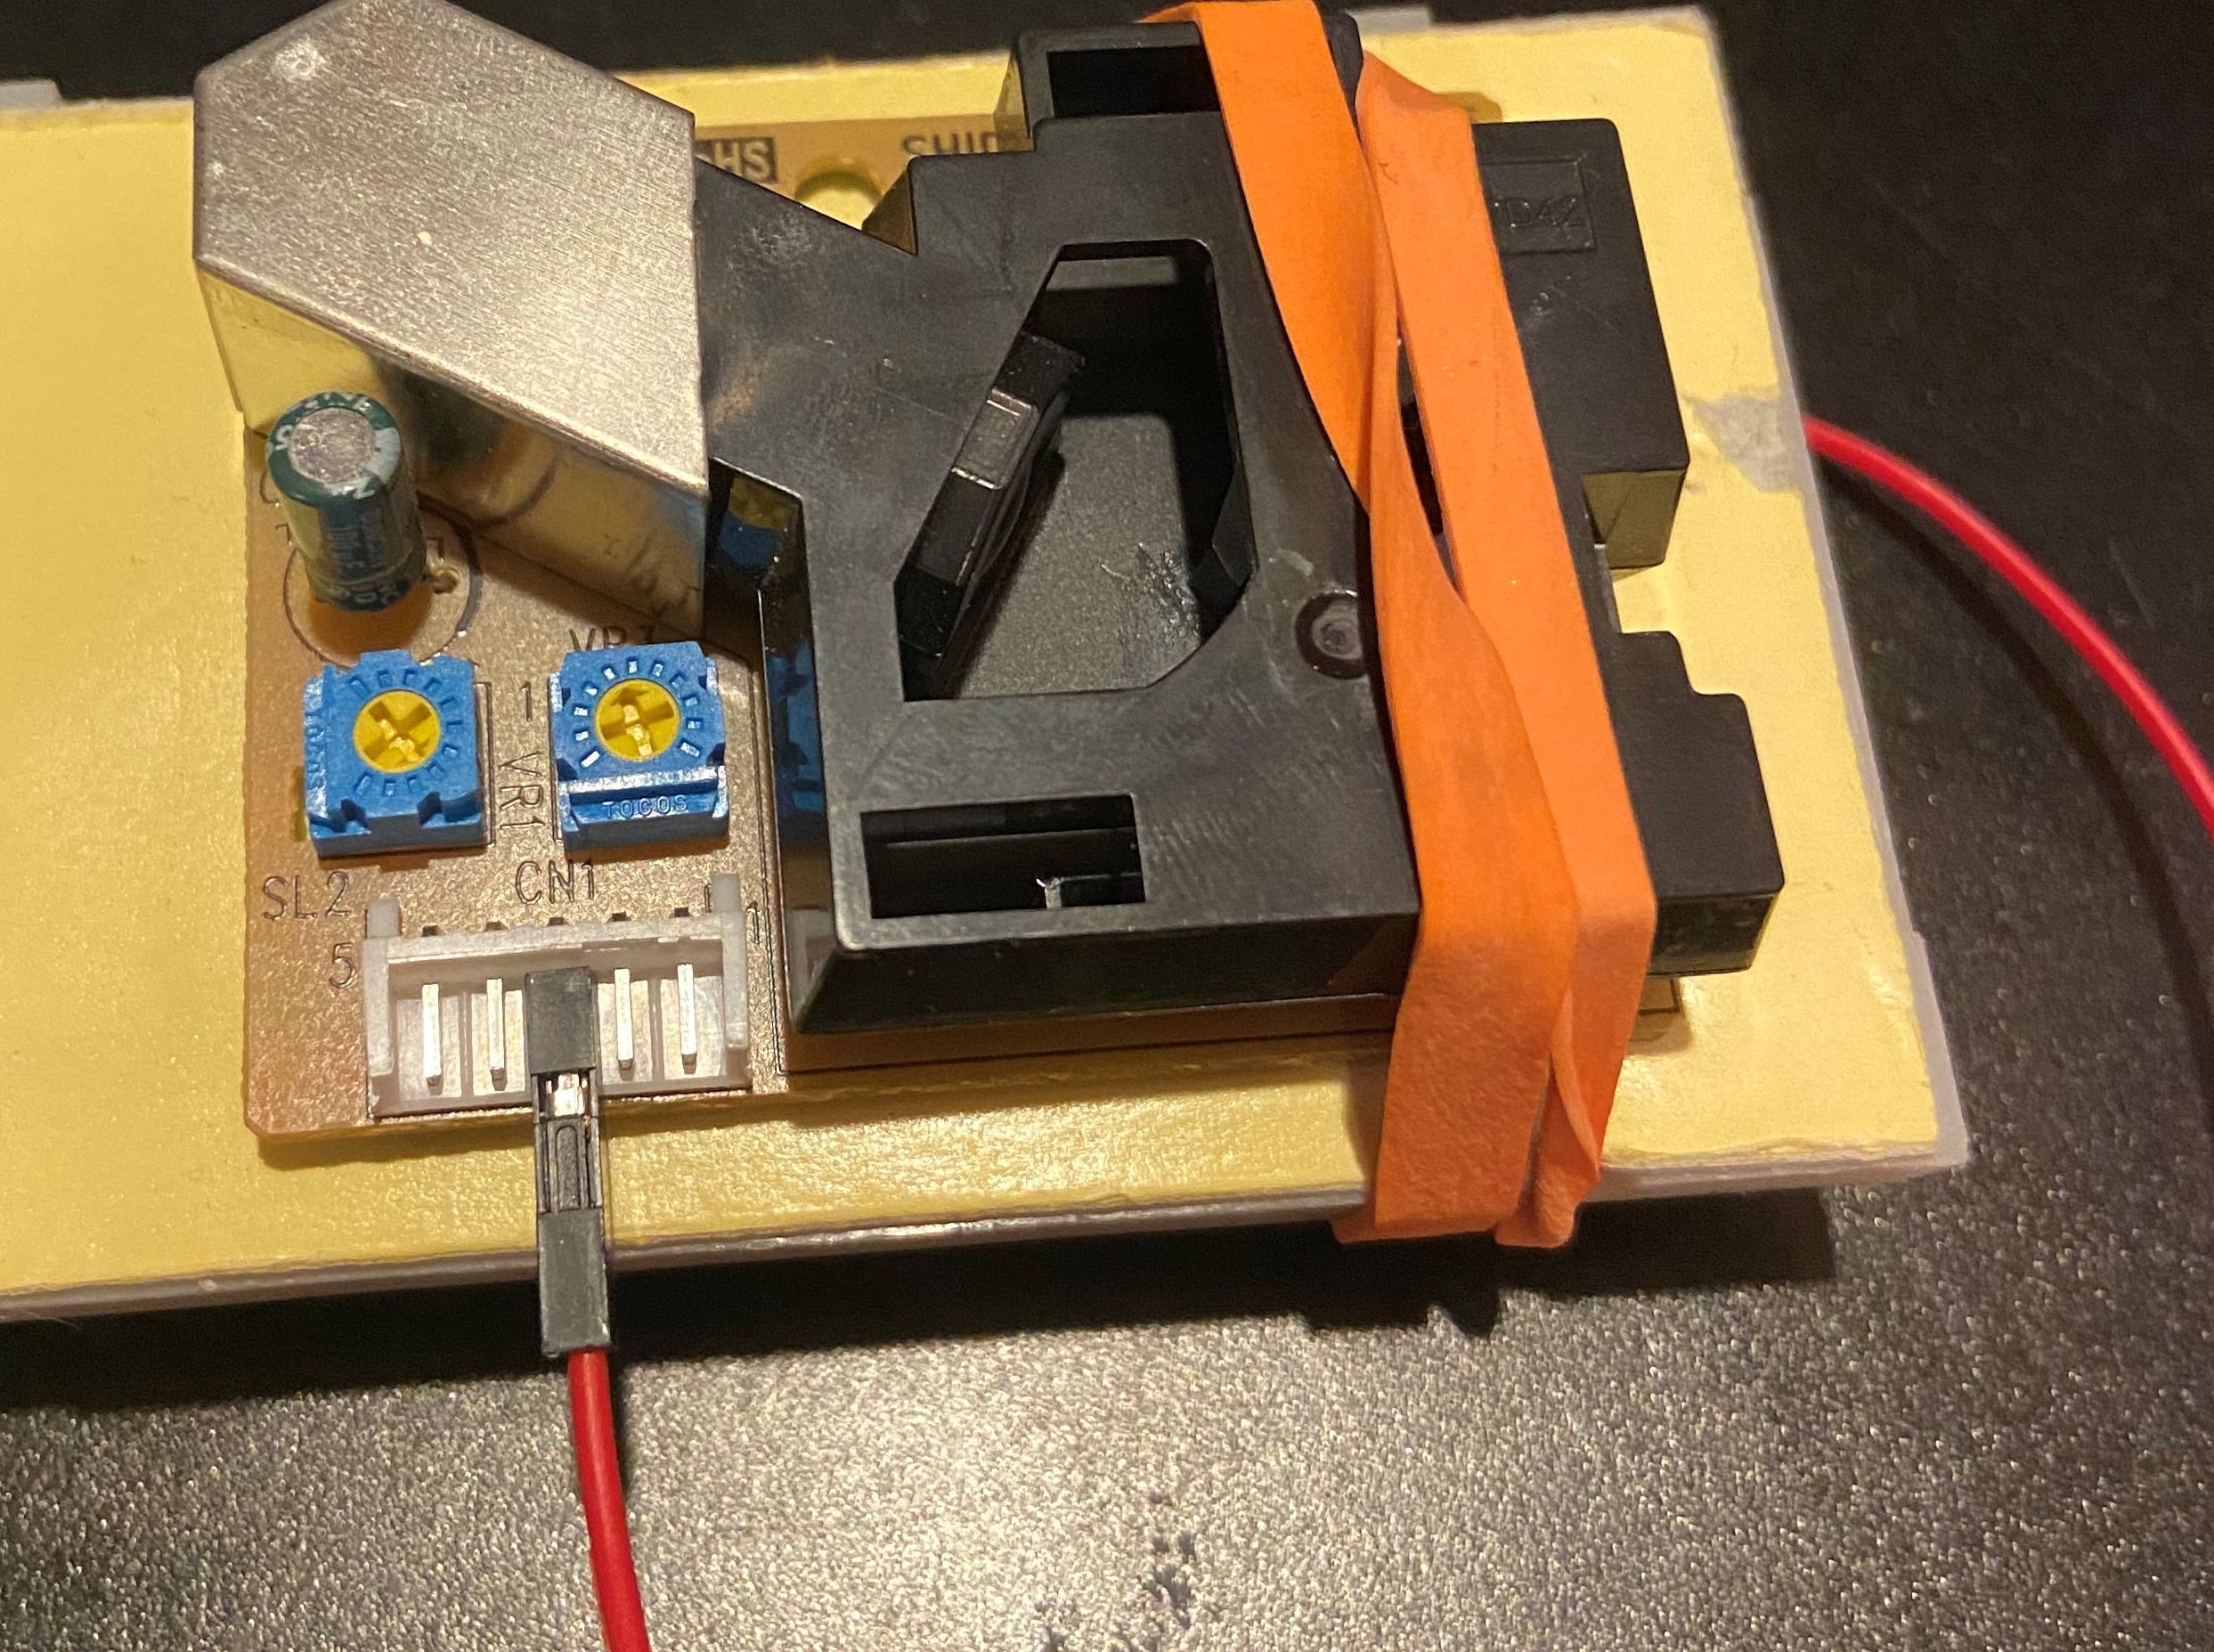
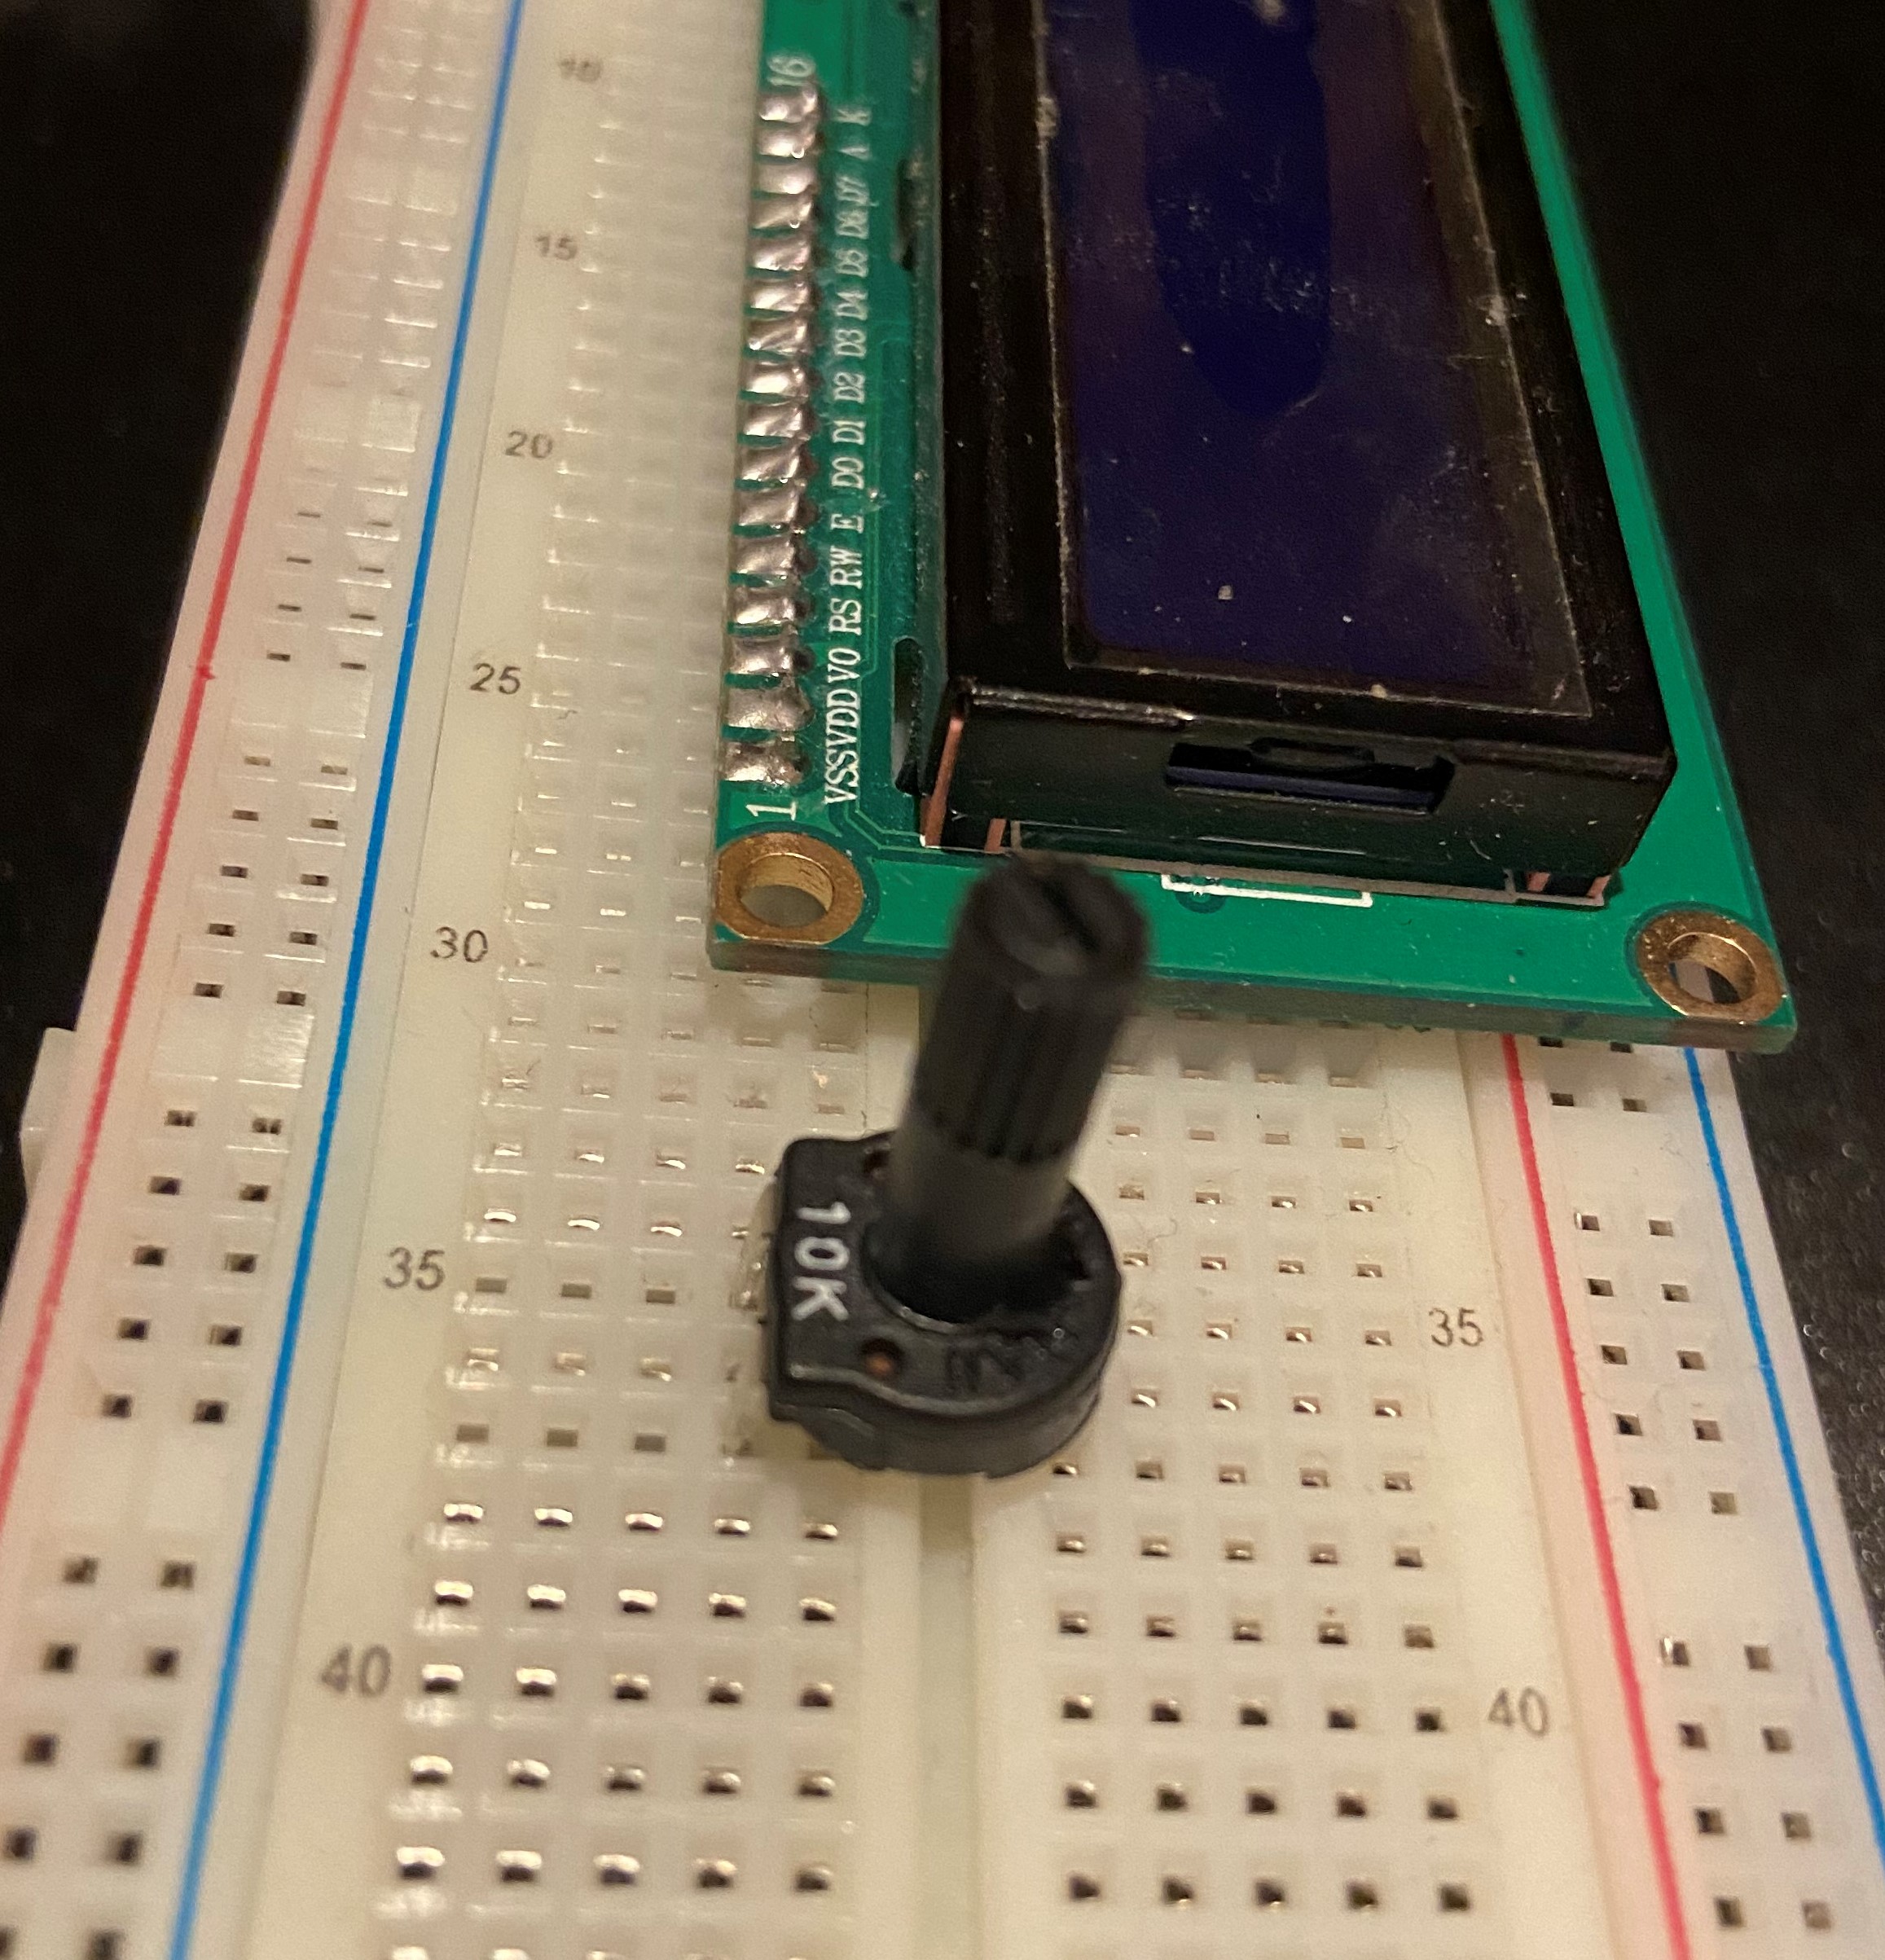
The last connection needed in this section is the small black dial labeled with a white "10k" marking. It has two prongs on one side and one on the other. Connect the two prong side to 35d and 37d with the single prong fitting nicely into 36f.
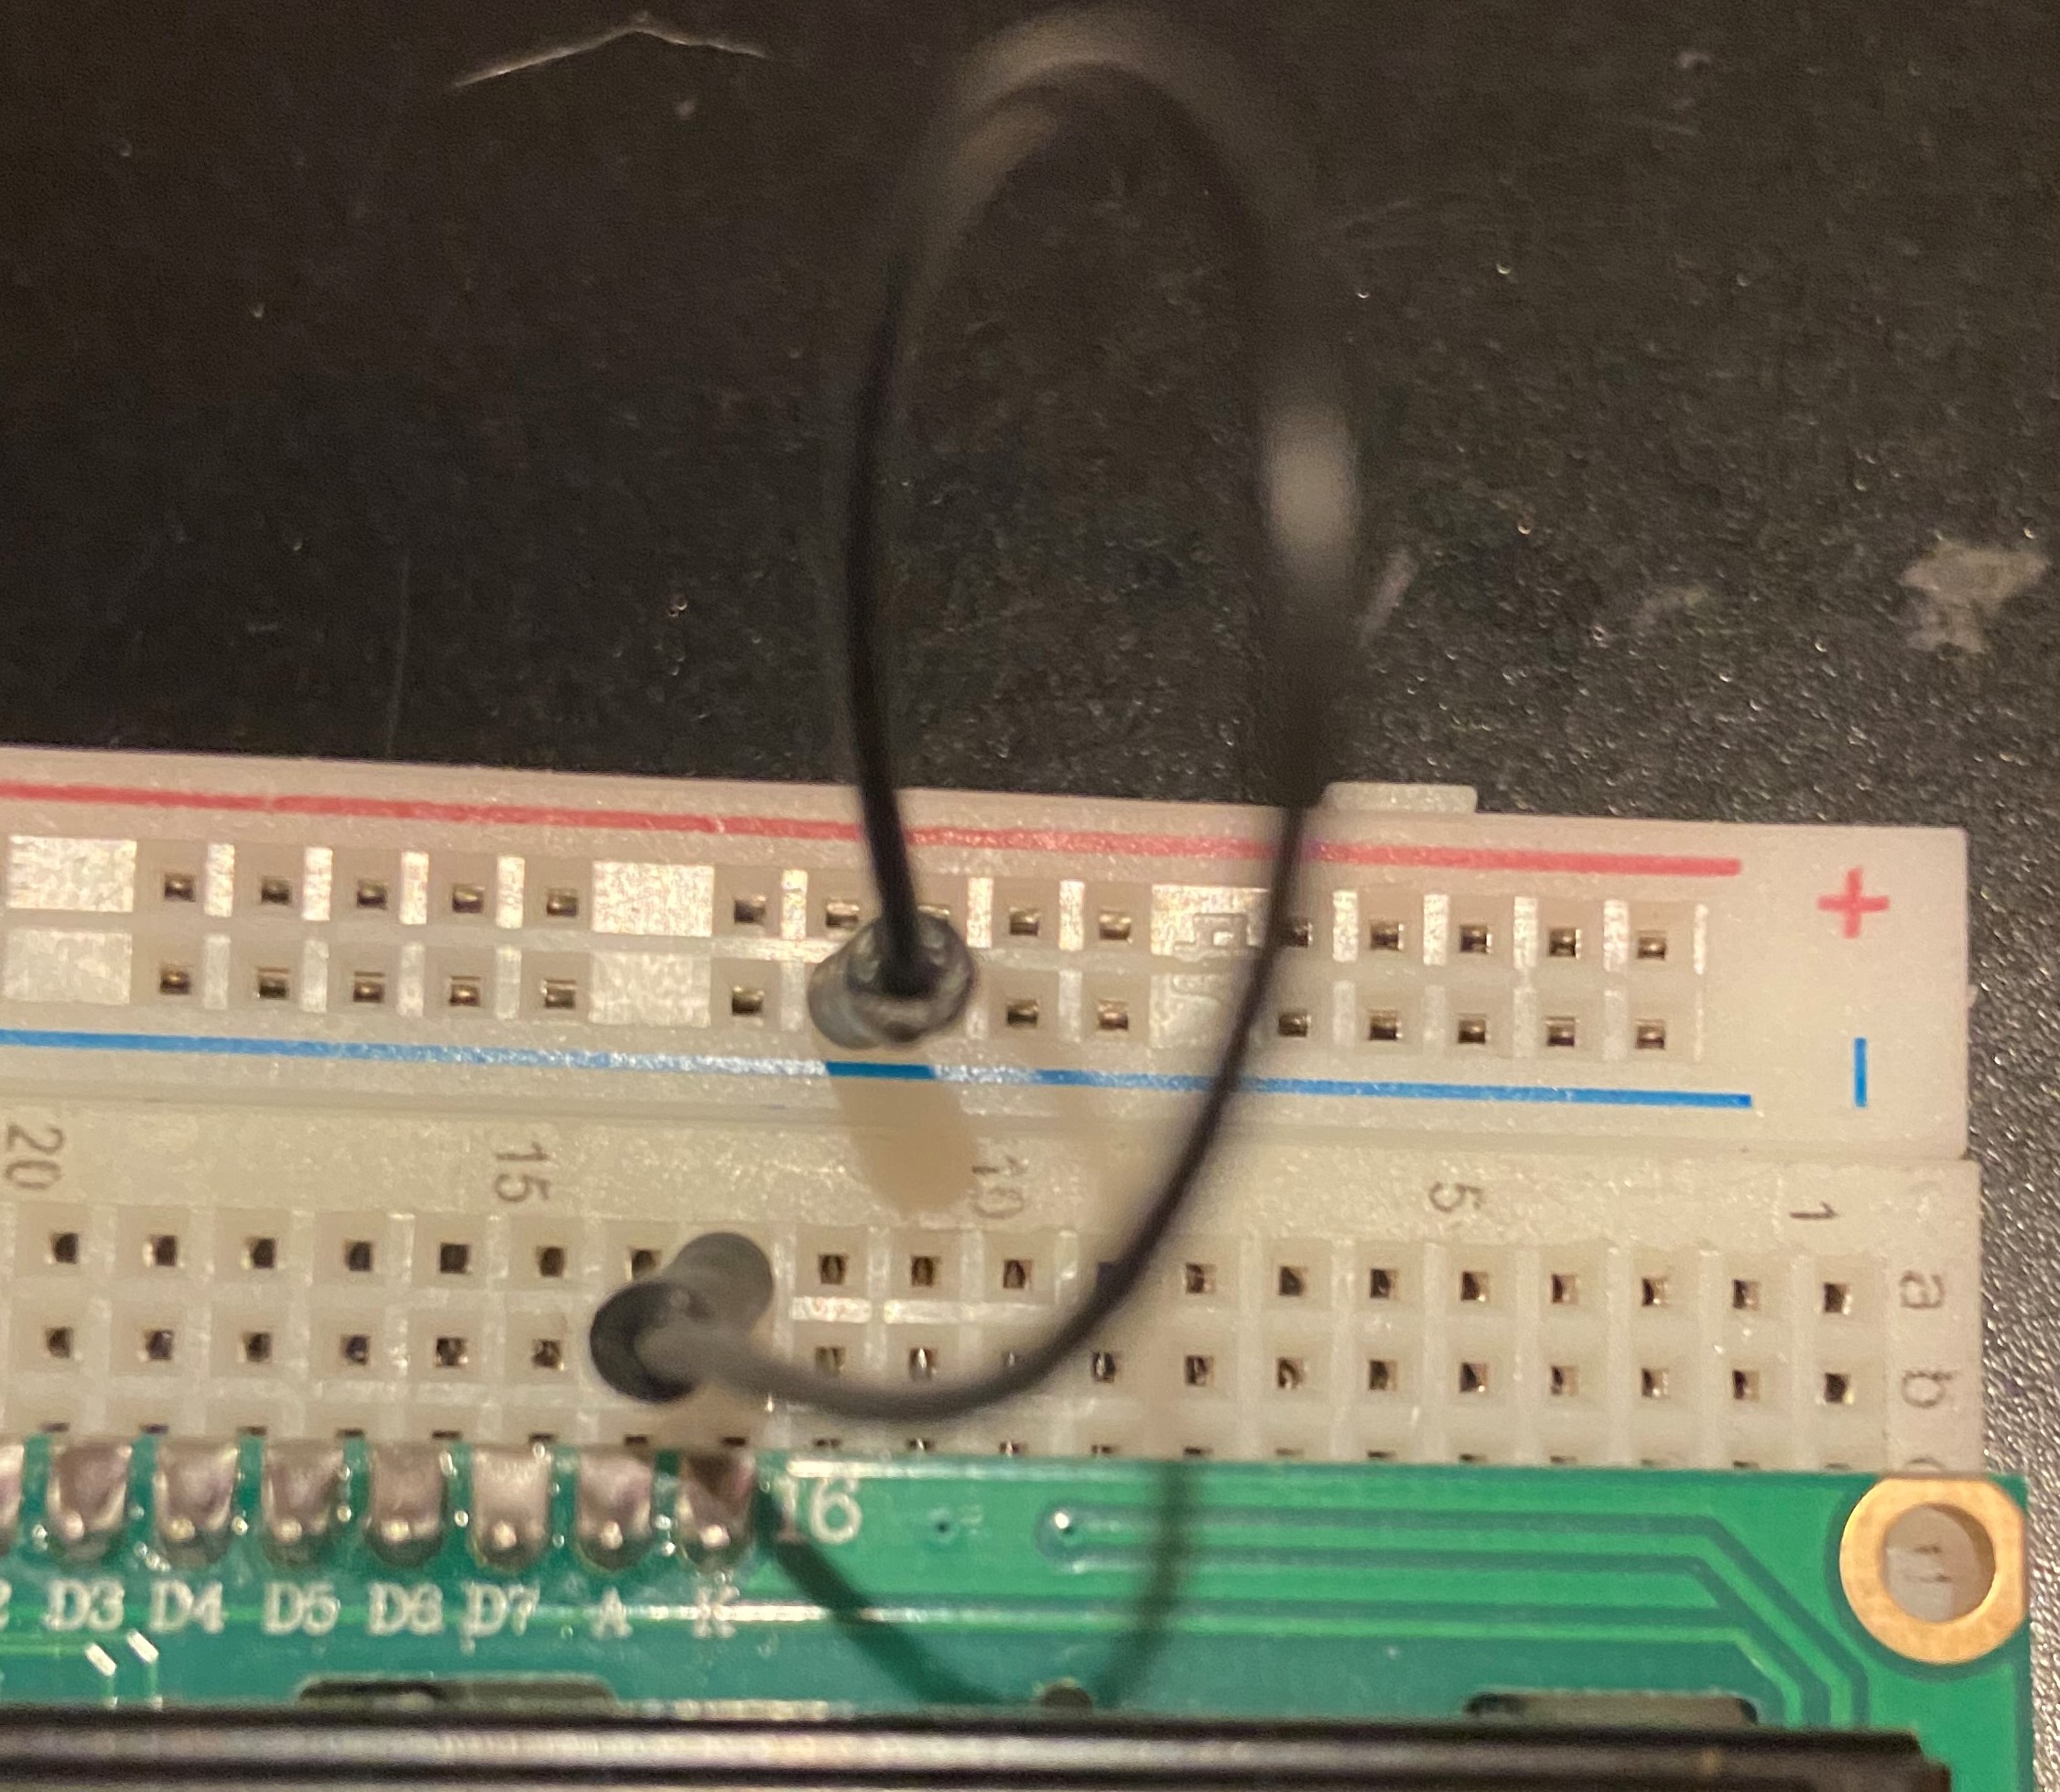
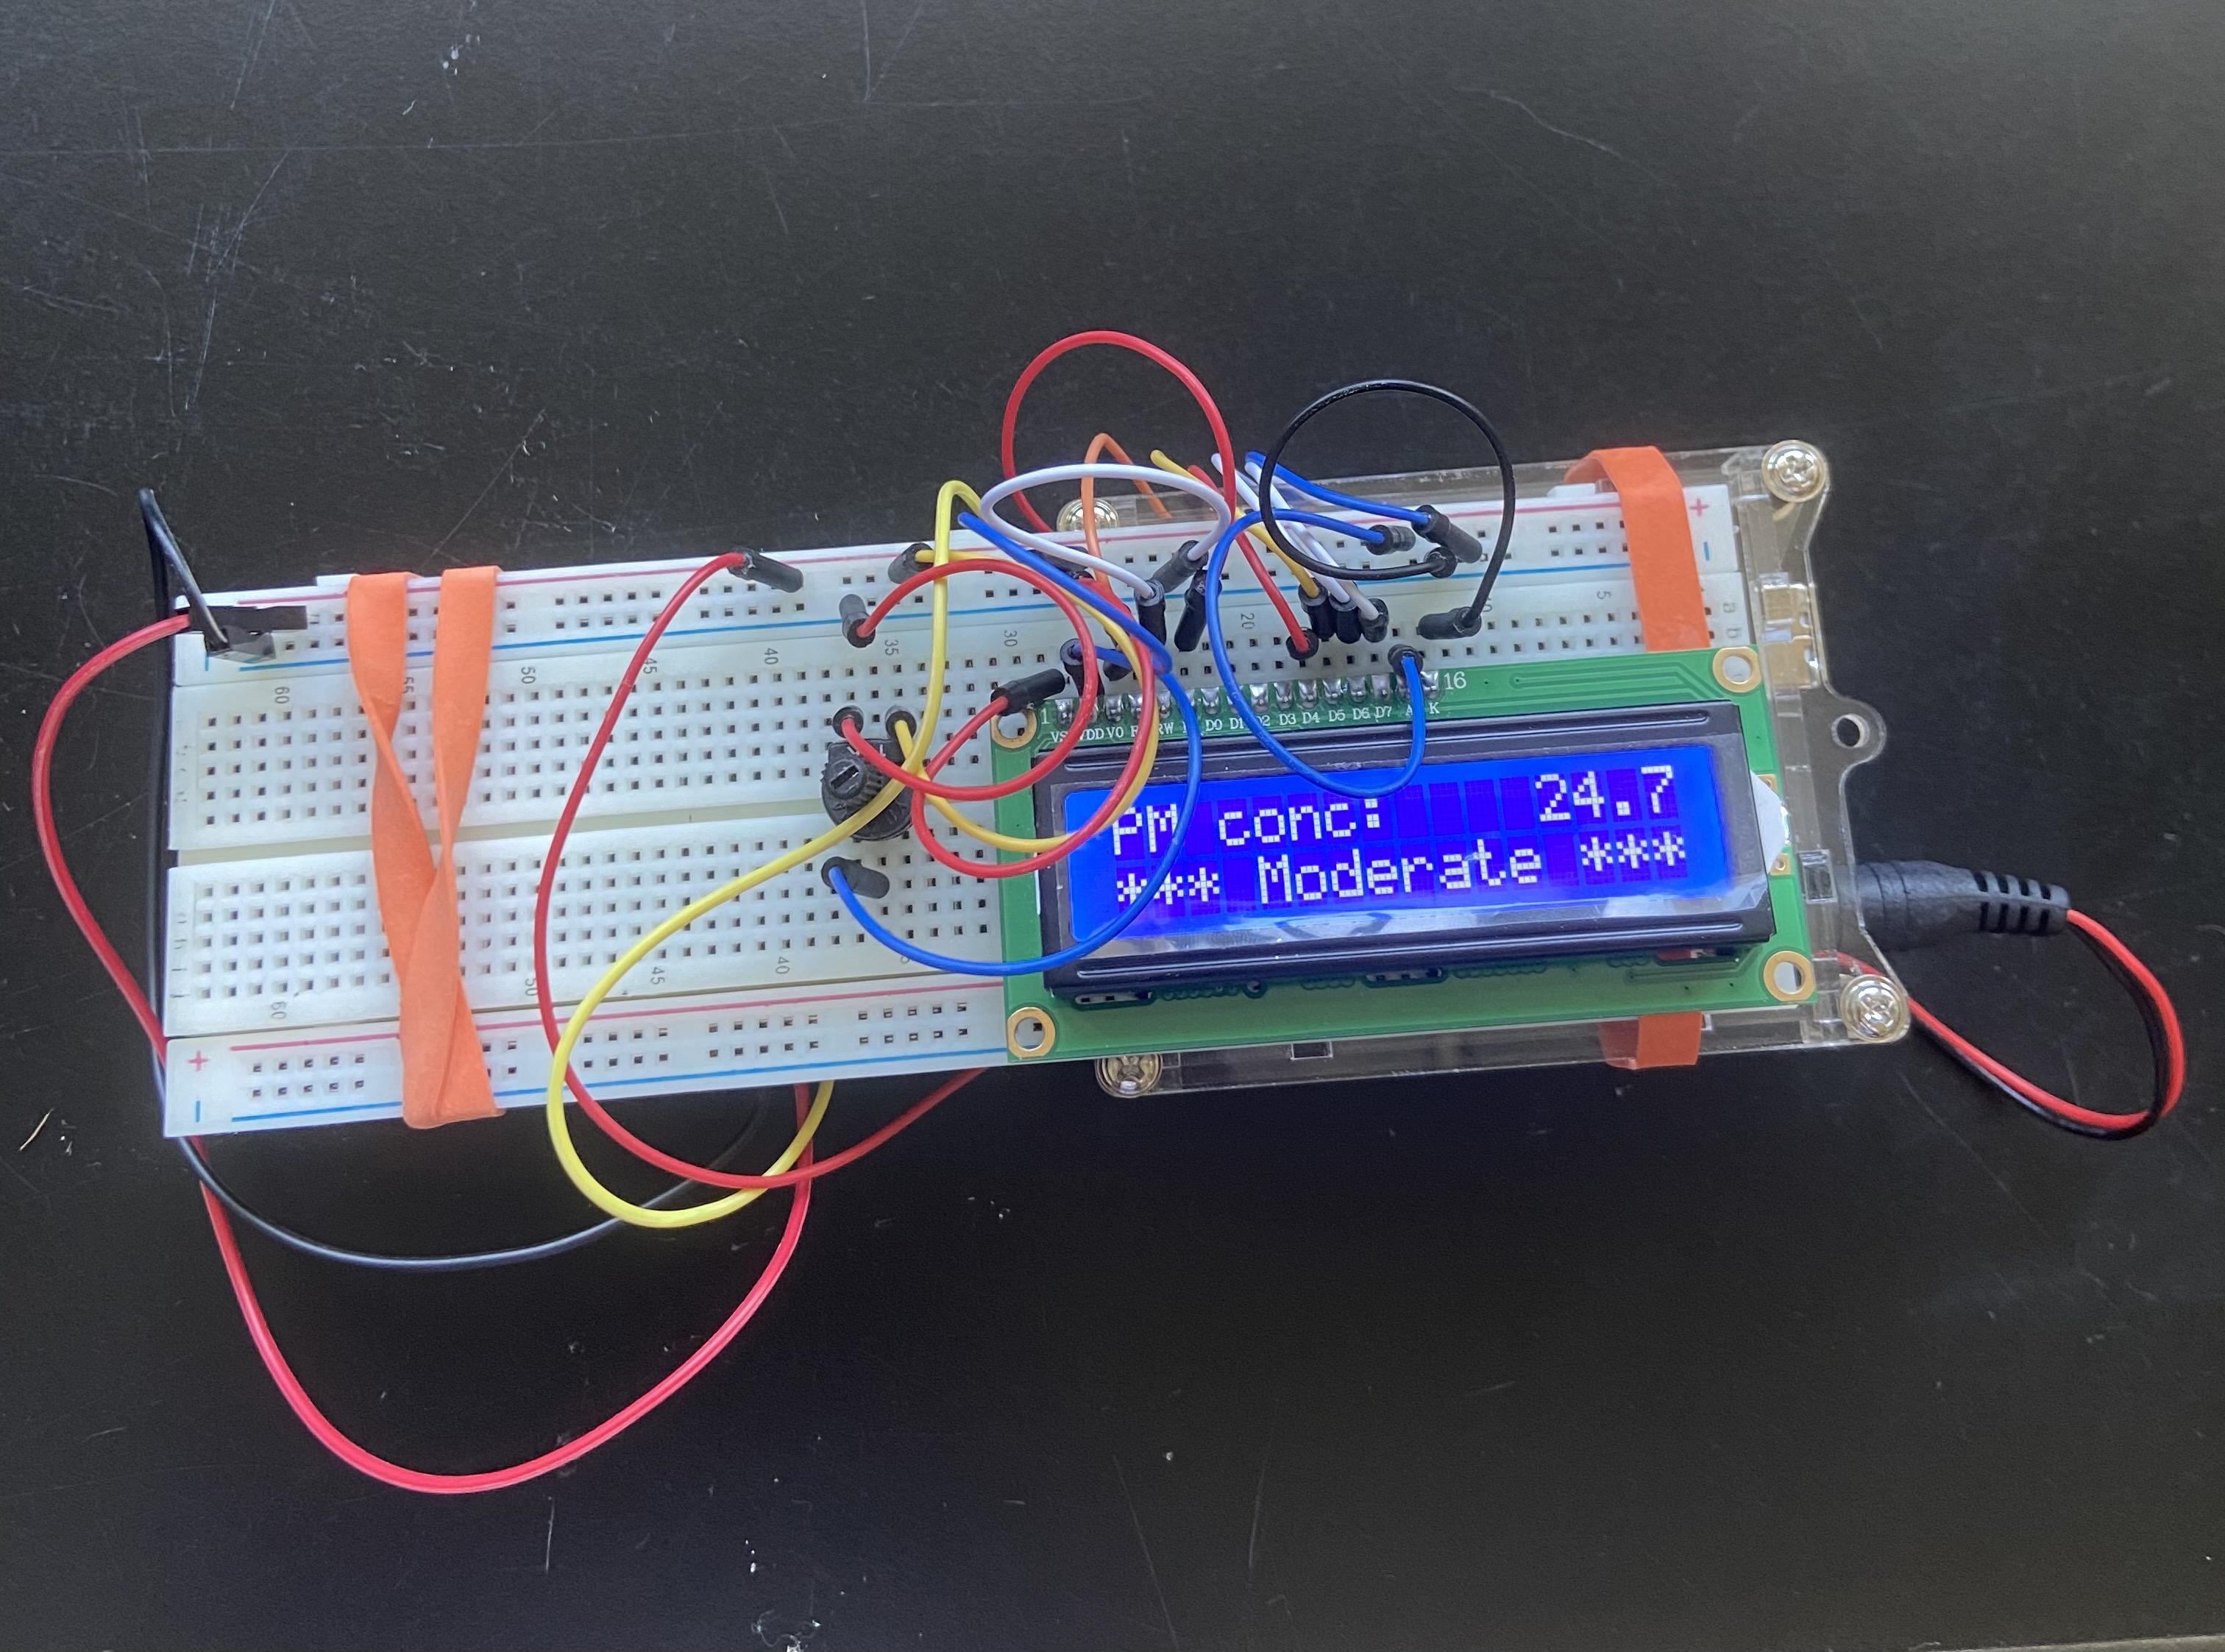
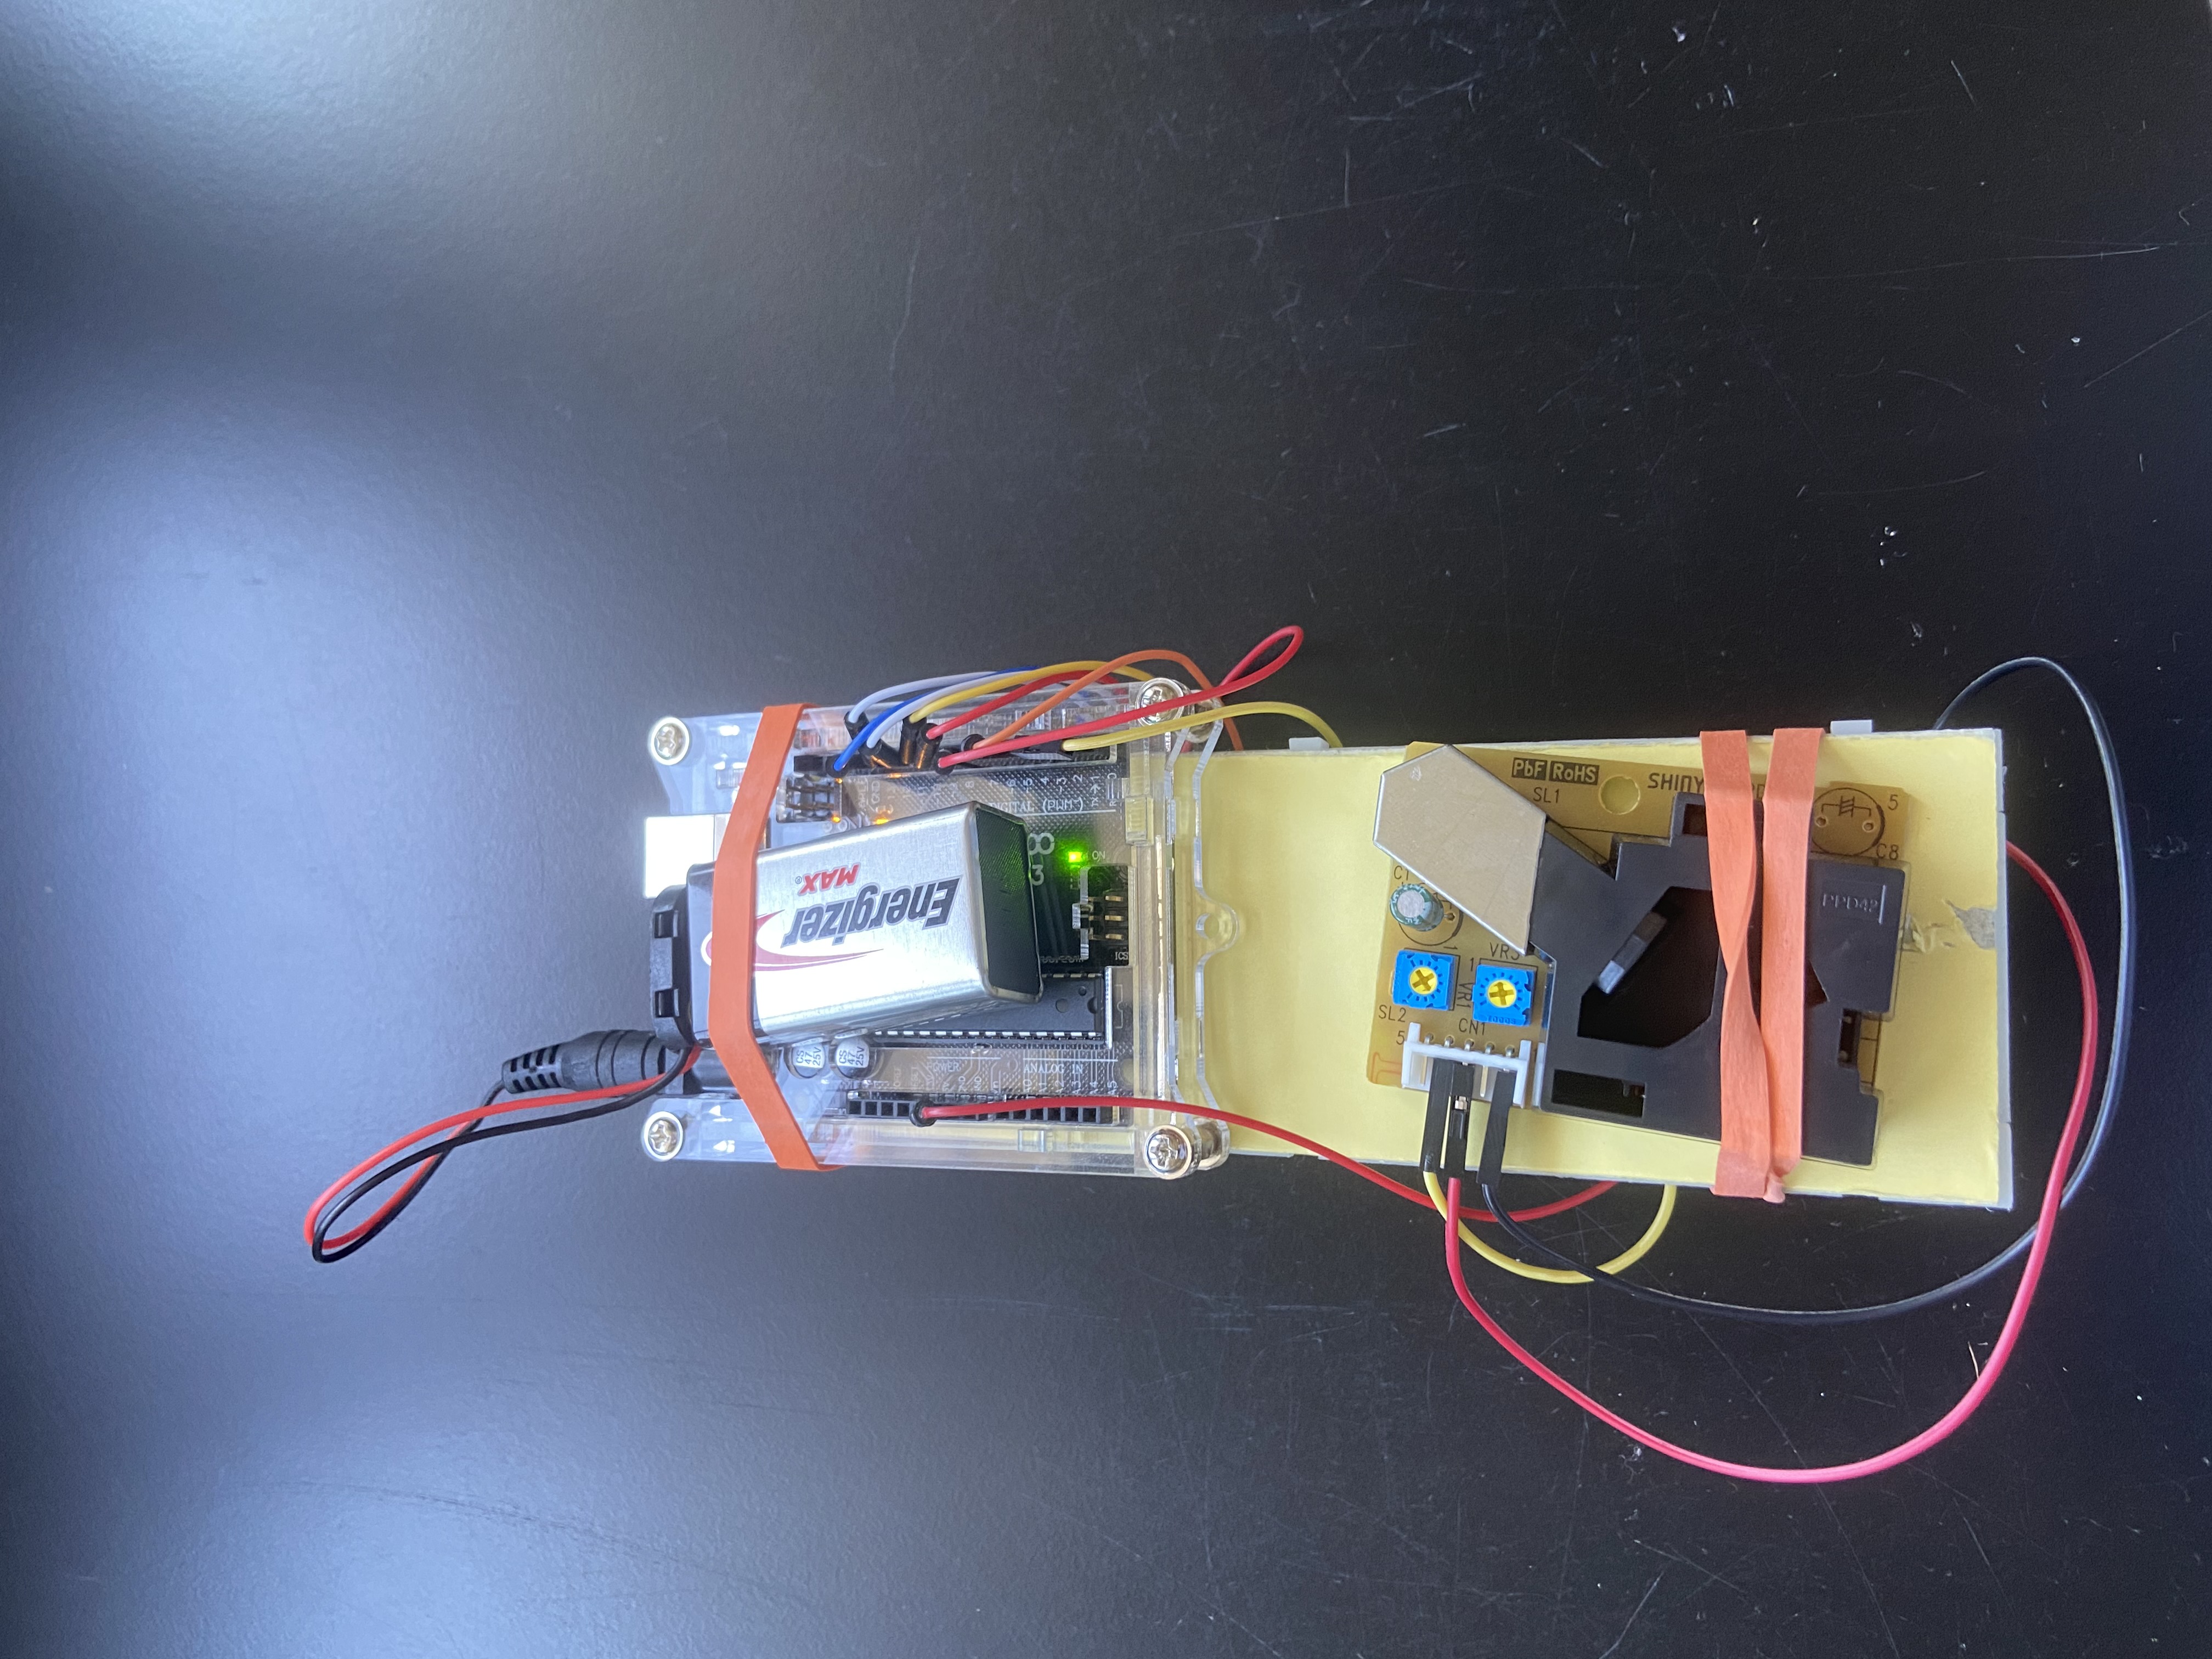
The last last last part to connect is the battery. A small device consisting of two wires will be used to do this. Clip one end to the two terminals on the 9v battery, then plug the other end (looks like an auxiliary input) into the black socket on the Arduino. Your LCD display should light up and show the surrounding particulate matter concentration!!! Below are some images of a complete make-up of one of our low-cost sensors so you can see what it should look like when complete!
Sources
https://www.epa.gov/sites/default/files/2016-04/documents/2012_aqi_factsheet.pdf